Answered step by step
Verified Expert Solution
Link Copied!

Question

1 Approved Answer

(b) Considering the set of processes in the following table: Process Burst Time Priority Arrival Time P1 10 3 0 P2 1 1 1 P3
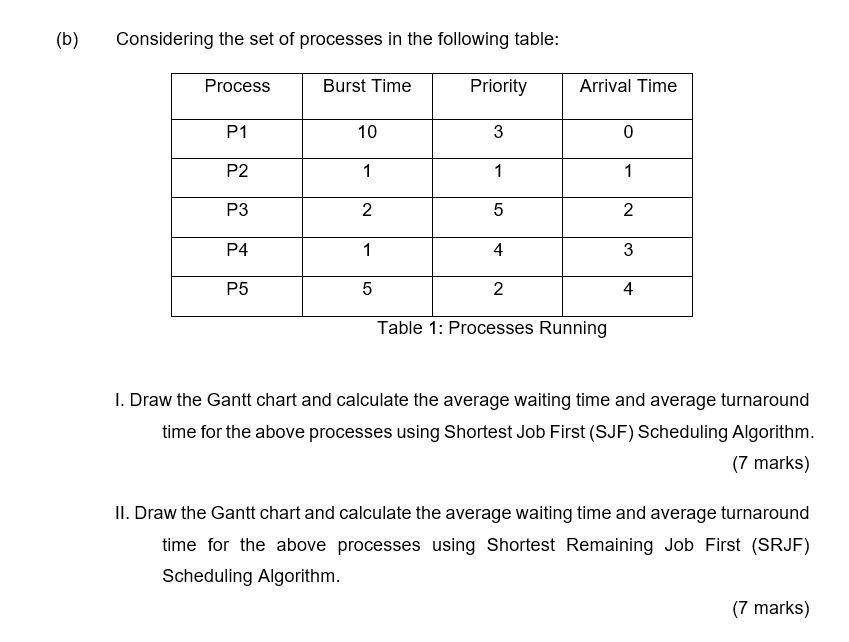
image text in transcribed

(b) Considering the set of processes in the following table: Process Burst Time Priority Arrival Time P1 10 3 0 P2 1 1 1 P3 2 5 N P4 1 4 3 P5 5 2 4 Table 1: Processes Running 1. Draw the Gantt chart and calculate the average waiting time and average turnaround time for the above processes using Shortest Job First (SJF) Scheduling Algorithm. (7 marks) II. Draw the Gantt chart and calculate the average waiting time and average turnaround time for the above processes using Shortest Remaining Job First (SRJF) Scheduling Algorithm. (7 marks)

Step by Step Solution

There are 3 Steps involved in it

Step: 1

blur-text-image

Get Instant Access to Expert-Tailored Solutions

See step-by-step solutions with expert insights and AI powered tools for academic success

Step: 2

blur-text-image

Step: 3

blur-text-image

Ace Your Homework with AI

Get the answers you need in no time with our AI-driven, step-by-step assistance

Get Started

Recommended Textbook for

Excel As Your Database

Authors: Paul Cornell

1st Edition

1590597516, 978-1590597514

More Books

Students also viewed these Databases questions

Question

How do Dimensional Database Models differ from Relational Models?

Answered: 1 week ago

Question

What type of processing do Relational Databases support?

Answered: 1 week ago

Question

Describe several aggregation operators.

Answered: 1 week ago