Answered step by step
Verified Expert Solution
Question
1 Approved Answer
B Distance, y (m) t1 (s) 1.5 1.25 1 0.75 0.5 0.25 0.553 0.502 0.45 0.387 0.319 0.223 t2 (s) C 0.56 0.504 0.45

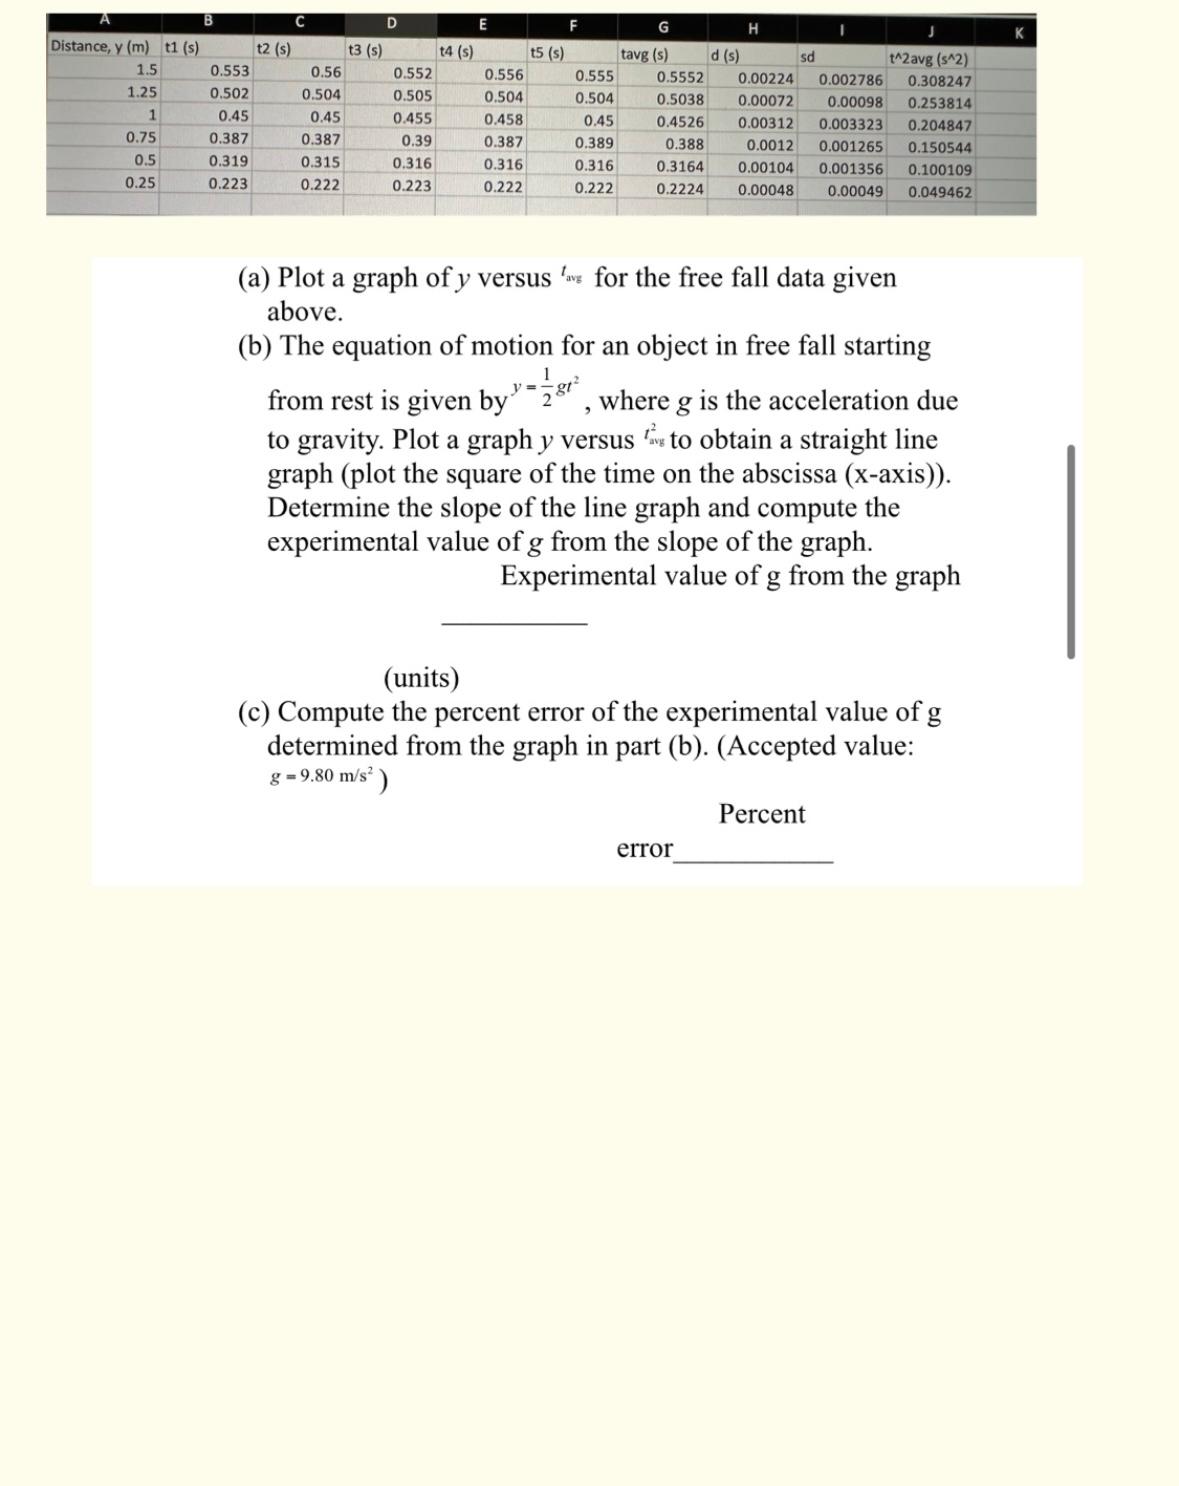
B Distance, y (m) t1 (s) 1.5 1.25 1 0.75 0.5 0.25 0.553 0.502 0.45 0.387 0.319 0.223 t2 (s) C 0.56 0.504 0.45 0.387 0.315 0.222 t3 (s) D 0.552 0.505 0.455 0.39 0.316 0.223 t4 (s) 0.556 0.504 0.458 0.387 0.316 0.222 t5 (s) F 0.555 0.504 0.45 0.389 0.316 0.222 G tavg (s) H d (s) t^2 avg (s^2) 0.00224 0.002786 0.308247 0.00072 0.00098 0.253814 0.00312 0.003323 0.204847 0.001265 0.150544 0.0012 0.00104 0.001356 0.100109 0.049462 sd 0.5552 0.5038 0.4526 0.388 0.3164 0.2224 0.00048 0.00049 error (a) Plot a graph of y versus lave for the free fall data given above. (b) The equation of motion for an object in free fall starting 1 from rest is given by, where g is the acceleration due to gravity. Plot a graph y versus to obtain a straight line graph (plot the square of the time on the abscissa (x-axis)). Determine the slope of the line graph and compute the experimental value of g from the slope of the graph. Experimental value of g from the graph (units) (c) Compute the percent error of the experimental value of g determined from the graph in part (b). (Accepted value: g = 9.80 m/s) Percent
Step by Step Solution
There are 3 Steps involved in it
Step: 1

Get Instant Access to Expert-Tailored Solutions
See step-by-step solutions with expert insights and AI powered tools for academic success
Step: 2

Step: 3

Ace Your Homework with AI
Get the answers you need in no time with our AI-driven, step-by-step assistance
Get Started


