

Answered step by step
Verified Expert Solution
Question
1 Approved Answer
B.) Draw the SML for this economy; plot the two securities on the SML graph along with the alphas of each. Please show & explain
B.) Draw the SML for this economy; plot the two securities on the SML graph along with the alphas of each.
Please show & explain all work and formulas. Thanks!
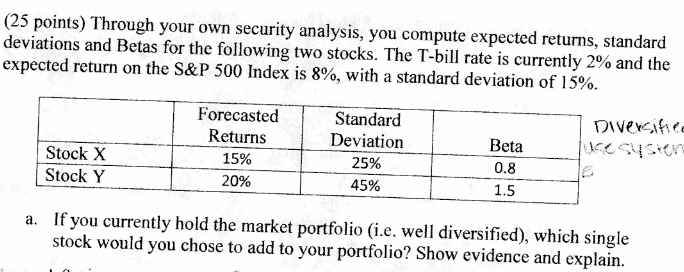
(25 points) Through your own security analysis, you compute expected returns, standard deviations and Betas for the following two stocks. The T-bill rate is currently 2% and the expected return on the S\&P 500 Index is 8%, with a standard deviation of 15%. Divercifie ce systed a. If you currently hold the market portfolio (i.e. well diversified), which single stock would you chose to add to your portfolio? Show evidence and explain. (25 points) Through your own security analysis, you compute expected returns, standard deviations and Betas for the following two stocks. The T-bill rate is currently 2% and the expected return on the S\&P 500 Index is 8%, with a standard deviation of 15%. Divercifie ce systed a. If you currently hold the market portfolio (i.e. well diversified), which single stock would you chose to add to your portfolio? Show evidence and explainStep by Step Solution
There are 3 Steps involved in it
Step: 1

Get Instant Access to Expert-Tailored Solutions
See step-by-step solutions with expert insights and AI powered tools for academic success
Step: 2

Step: 3
Ace Your Homework with AI
Get the answers you need in no time with our AI-driven, step-by-step assistance
Get Started
The Handbook Of Municipal Bonds
Authors: Frank J. Fabozzi, Sylvan G. Feldstein
1st Edition
0470108754, 9780470108758