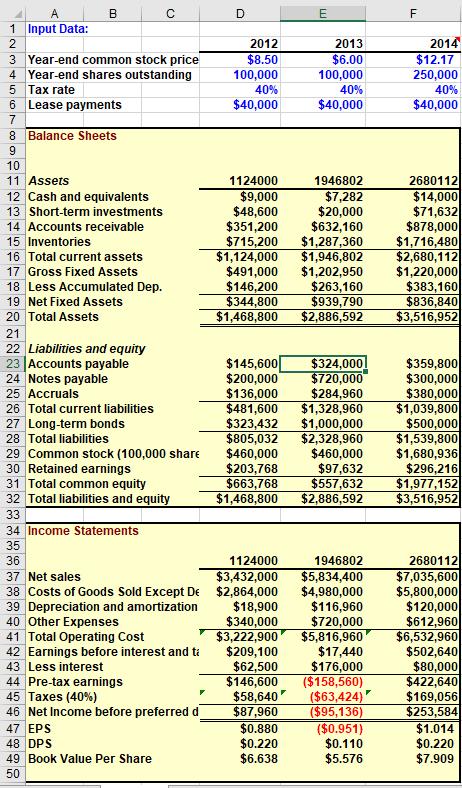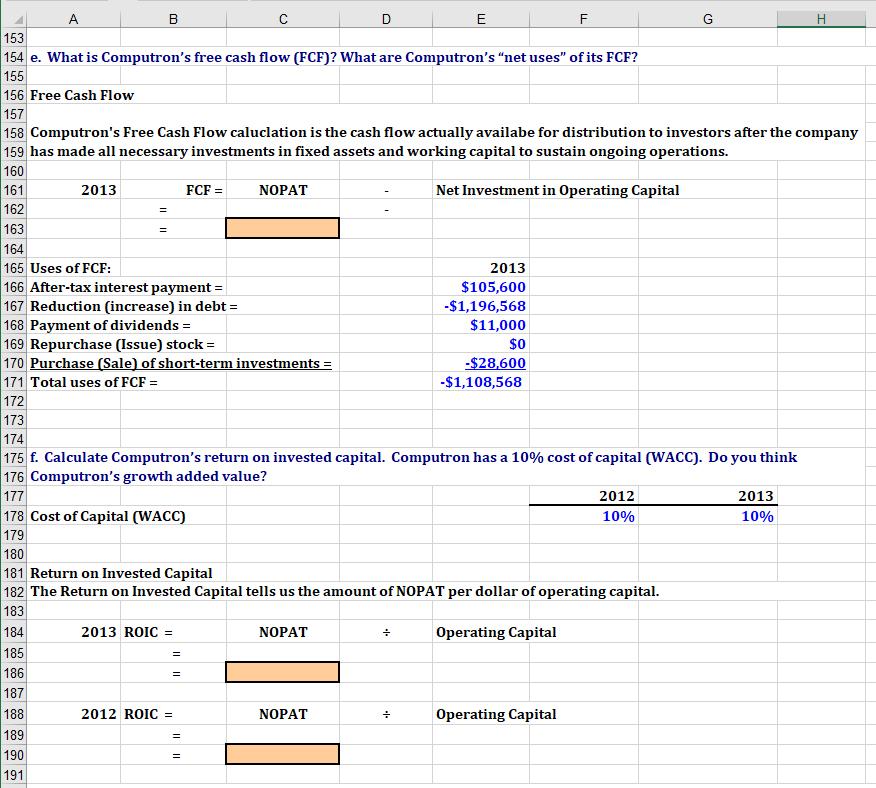

B E F 2013 $6.00 100,000 40% $40,000 2014 $12.17 250,000 40% $40,000 1946802 $7,282 $20,000 $632,160 $1,287,360 $1,946,802 $1,202,950 $263,160 $939,790 $2,886,592 2680112 $14,000 $71,6321 $878,000 $1,716,480 $2,680,112 $1,220,000 $383,160 $836,8401 $3,516,952 A B D 1 Input Data: 2 2012 3 Year-end common stock price $8.50 4 Year-end shares outstanding 100,000 5 Tax rate 40% 6 Lease payments $40,000 7 8 Balance Sheets 9 10 11 Assets 1124000 12 Cash and equivalents $9,000 13 Short-term investments $48,600 14 Accounts receivable $351,200 15 Inventories $715,200 16 Total current assets $1,124,000 17 Gross Fixed Assets $491,000 18 Less Accumulated Dep. $146,200 19 Net Fixed Assets $344,800 20 Total Assets $1,468,800 21 22 Liabilities and equity 23 Accounts payable $145,600 24 Notes payable $200,000 25 Accruals $136,000 26 Total current liabilities $481,600 27 Long-term bonds $323,432 28 Total liabilities $805,032 29 Common stock (100,000 share $460,000 30 Retained earnings $203,768 31 Total common equity $663,768 32 Total liabilities and equity $1,468,800 33 34 Income Statements 35 36 1124000 37 Net sales $3,432,000 38 Costs of Goods Sold Except De $2,864,000 39 Depreciation and amortization $18,900 40 Other Expenses $340,000 41 Total Operating cost $3,222,900 42 Earnings before interest and ta $209,100 43 Less interest $62,500 44 Pre-tax earnings $146,600 45 Taxes (40%) $58,640 46 Net Income before preferred d $87,960 47 EPS $0.880 48 DPS $0.220 49 Book Value Per Share $6.638 50 $324,000! $720,000 $284,960 $1,328,960 $1,000,000 $2,328,960 $460,000 $97,632 $557,632 $2,886,592 $359,800 $300,000 $380,000 $1,039,800 $500,000 $1,539,800 $1,680,936 $296,216 $1,977,152 $3,516,952 1946802 $5,834,400 $4,980,000 $116,960 $720,000 $5,816,960 $17,440 $176,000 ($158,560) ($63,424) ($95,136) ($0.951) $0.110 $5.576 2680112 $7,035,600 $5,800,000 $120,000 $612,9601 $6,532,960 $502,640 $80,0001 $422,640 $169,056 $253,584 $1.014 $0.220 $7.909 E F = B D E H 153 154 e. What is Computron's free cash flow (FCF)? What are Computron's "net uses" of its FCF? 155 156 Free Cash Flow 157 158 Computron's Free Cash Flow caluclation is the cash flow actually availabe for distribution to investors after the company 159 has made all necessary investments in fixed assets and working capital to sustain ongoing operations. 160 161 2013 FCF = NOPAT Net Investment in Operating Capital 162 163 164 165 Uses of FCF: 2013 166 After-tax interest payment = $105,600 167 Reduction (increase) in debt = -$1,196,568 168 Payment of dividends = $11,000 169 Repurchase (Issue) stock = $0 170 Purchase (Sale) of short-term investments = -$28,600 171 Total uses of FCF = -$1,108,568 172 173 174 175 f. Calculate Computron's return on invested capital. Computron has a 10% cost of capital (WACC). Do you think 176 Computron's growth added value? 177 2012 2013 178 Cost of Capital (WACC) 10% 10% 179 180 181 Return on Invested Capital 182 The Return on Invested Capital tells us the amount of NOPAT per dollar of operating capital. 183 184 2013 ROIC = NOPAT Operating Capital 185 186 187 188 2012 ROIC = NOPAT Operating Capital 189 190 191 + . II 11


