b) Explain whether you think NFI Groups financial health is improving or worsening, based on the changes to the above ratios from 2016-2020. Comment on any particular ratios or changes that you believe are significant
| Profitability | Dec 2020 | Dec 2019 | Dec 2018 | Dec 2017 | Dec 2016 |
| Gross Margin = Gross Profit /Sales | 8.24% | 14.29% | 18.03% | 18.95% | 17.56% |
| Operating Margin = Operating Income / Sales | -1.32% | 5.95% | 9.76% | 10.72% | 9.36% |
| Net Profit Margin = Net Income / Sales | -6.52% | 1.99% | 6.35% | 8.03% | 5.49% |
| Liquidity | | | | | |
| Current ratio = current assets / current liabilities | 1.75 | 1.72 | 1.93 | 1.88 | 1.83 |
| Quick ratio = (cash + marketable securities + accounts receivable) / current liabilities | 0.65 | 0.68 | 0.82 | 0.82 | 0.86 |
| Cash ratio = Cash / current liabilities | 0.08 | 0.04 | 0.02 | 0.00 | 0.03 |
| Working Capital | | | | | |
| Accounts receivable days = Accounts Receivable / (Sales/365) | 57.80 | 59.48 | 51.94 | 53.49 | 55.63 |
| Accounts payable days = Accounts payable / (Cost of Sales/365) | 86.07 | 85.60 | 64.79 | 61.78 | 62.71 |
| Inventory turnover = Annual cost of sales / inventory | 3.38 | 3.69 | 4.86 | 5.37 | 5.14 |
| Interest Coverage | | | | | |
| EBIT/ Interest Expense | -1.52 | 2.97 | 8.84 | 12.57 | 8.22 |
| EBITDA /Interest expense | 0.27 | 5.04 | 11.37 | 15.33 | 10.45 |
| Leverage | | | | | |
| Debt-equity ratio = total debt / total equity | 1.82 | 1.29 | 0.80 | 0.77 | 0.89 |
| Debt-to-capital ratio = total debt / (total debt + total equity) | 0.64 | 0.56 | 0.45 | 0.44 | 0.47 |
| Debt-to-Enterprise Value ratio = Net debt / (Enterprise Value) | 0.37 | 0.32 | 0.20 | 0.12 | 0.15 |
| Valuation | | | | | |
| Price-earnings (P/E) ratio = Share Price / Earnings per Share | -9.56 | 30.52 | 13.04 | 17.82 | 19.63 |
| Operating Returns | | | | | |
| Return on Equity = Net Income / Book Value of Equity | -0.25 | 0.07 | 0.20 | 0.25 | 0.20 |
| Return on Assets = (Net Income + Interest Expense) / Total Assets | -0.03 | 0.04 | 0.09 | 0.11 | 0.08 |
| Return on invested capital = EBIT (1 tax rate) / (Book value of equity + Net debt) | -0.07 | 0.11 | 0.28 | 0.33 | 0.30 |
c) Examine NFI Groups Statement of Cash Flows from 2016-2020, describe what you believe is significant, and explain try to explain what led to these significant items. Also explain whether you believe NFI Groups financial health is improving or worsening, based on its cash flow statements
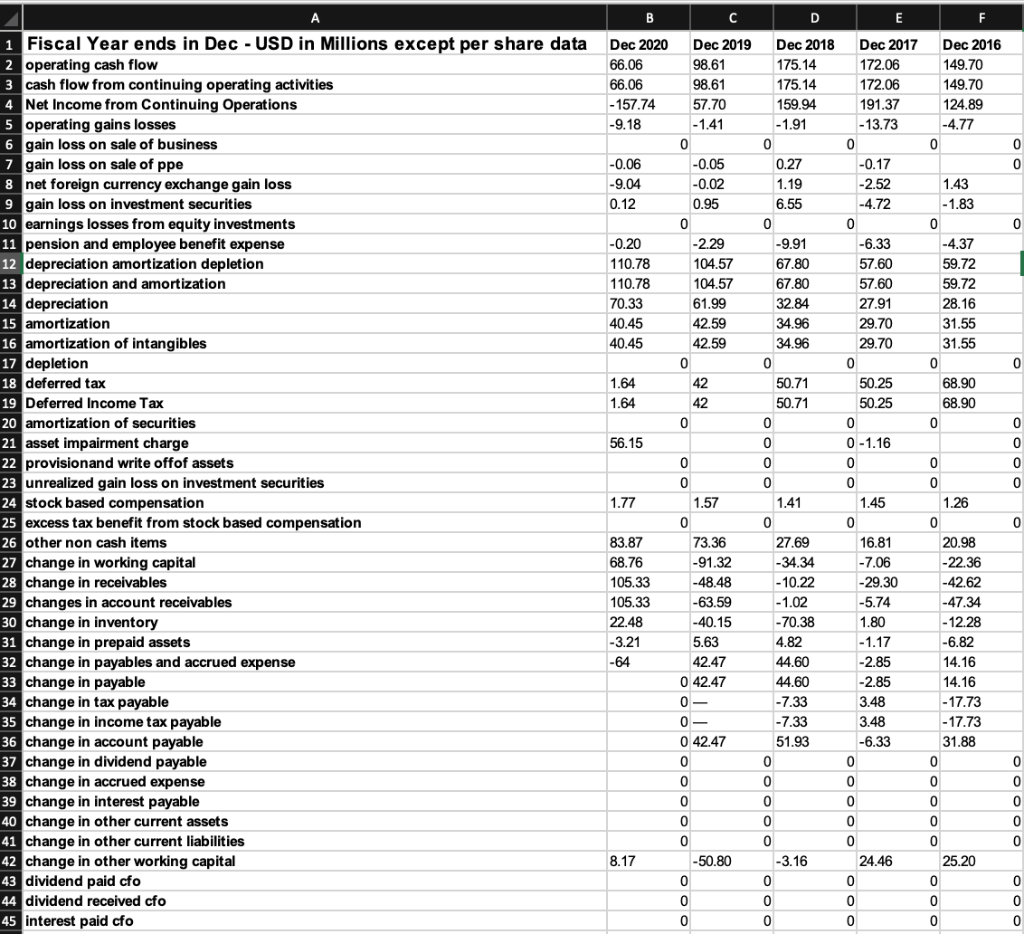
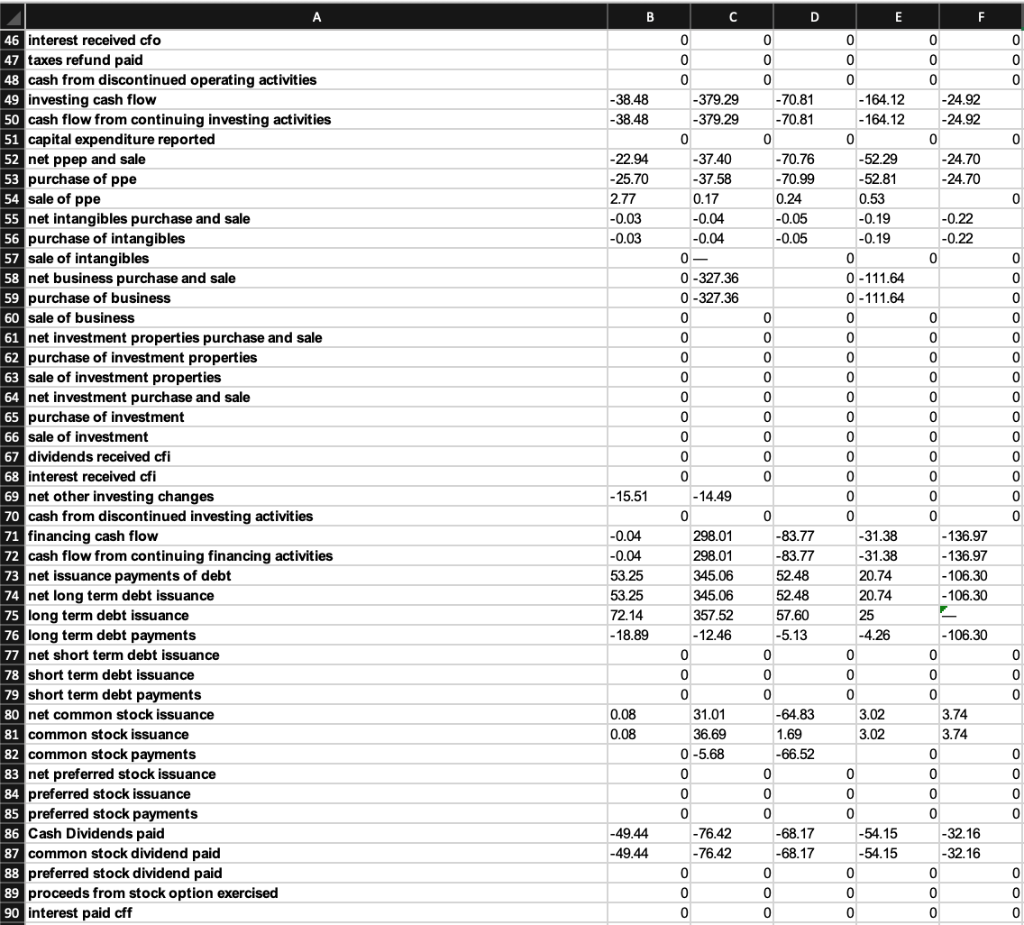
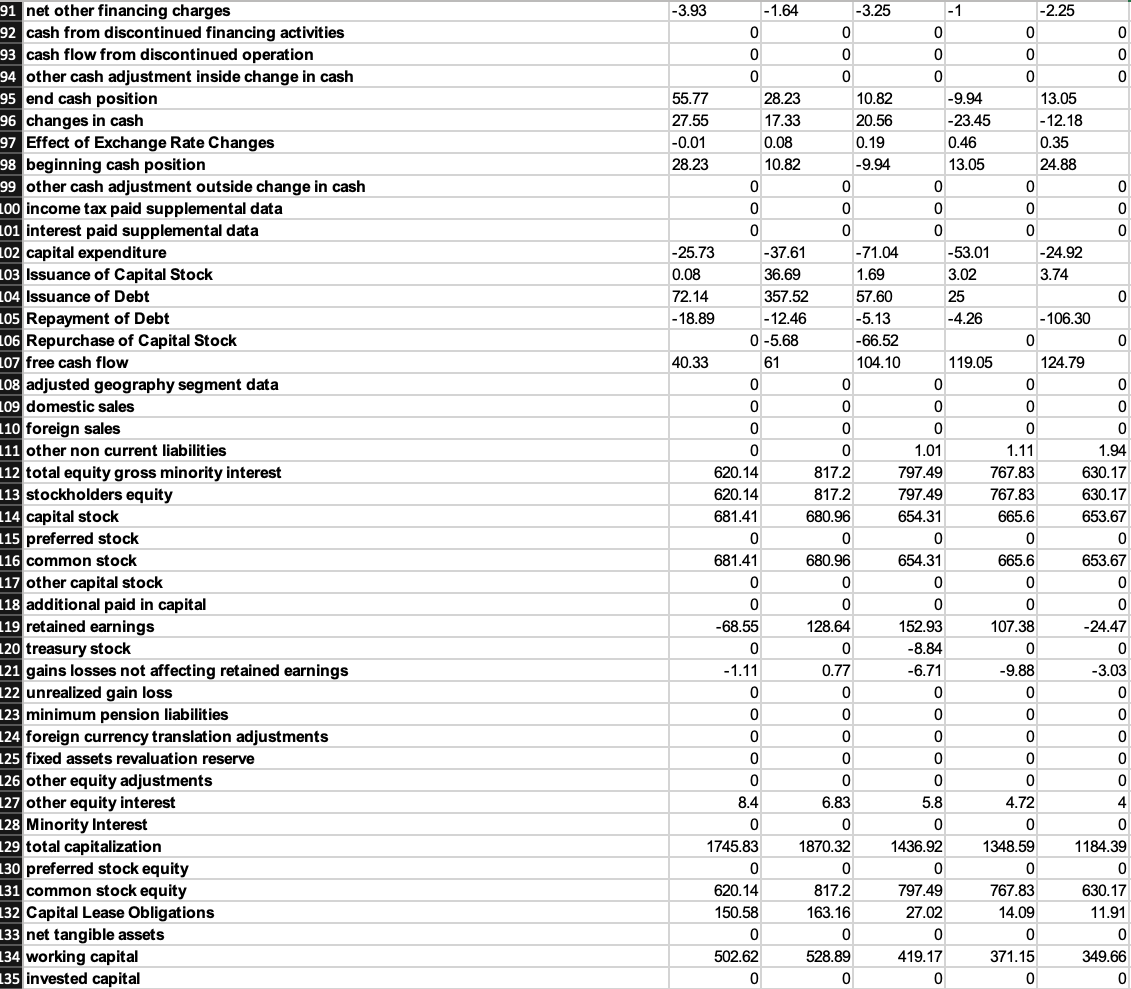
B D E F Dec 2020 66.06 66.06 - 157.74 -9.18 Dec 2019 98.61 98.61 57.70 -1.41 0 -0.05 Dec 2018 175.14 175.14 159.94 -1.91 Dec 2016 149.70 149.70 124.89 -4.77 0 0 0 0 -0.06 -9.04 0.12 -0.02 1.43 0 -0.20 110.78 110.78 70.33 40.45 40.45 0.95 0 -2.29 104.57 104.57 61.99 42.59 42.59 0 42 42 0 0.27 1.19 6.55 0 -9.91 67.80 67.80 32.84 34.96 34.96 0 50.71 50.71 -1.83 0 -4.37 59.72 59.72 28.16 31.55 31.55 0 68.90 68.90 0 0 1.64 1.64 Dec 2017 172.06 172.06 191.37 - 13.73 0 -0.17 -2.52 -4.72 0 -6.33 57.60 57.60 27.91 29.70 29.70 0 50.25 50.25 0 0 - 1.16 0 0 1.45 0 16.81 -7.06 -29.30 -5.74 1.80 - 1.17 -2.85 -2.85 3.48 3.48 0 0 56.15 0 0 1 Fiscal Year ends in Dec - USD in Millions except per share data operating cash flow 3 cash flow from continuing operating activities 4 Net Income from Continuing Operations 5 operating gains losses 6 gain loss on sale of business 7 gain loss on sale of ppe 8 net foreign currency exchange gain loss 9 gain loss on investment securities 10 earnings losses from equity investments 11 pension and employee benefit expense 12 depreciation amortization depletion 13 depreciation and amortization 14 depreciation 15 amortization 16 amortization of intangibles 17 depletion 18 deferred tax 19 Deferred Income Tax 20 amortization of securities 21 asset impairment charge 22 provisionand writ offof assets 23 unrealized gain loss on investment securities 24 stock based compensation 25 excess tax benefit from stock based compensation 26 other non cash items 27 change in working capital 28 change in receivables 29 changes in account receivables 30 change in inventory 31 change in prepaid assets 32 change in payables and accrued expense 33 change in payable 34 change in tax payable 35 change in income tax payable 36 change in account payable 37 change in dividend payable 38 change in accrued expense 39 change in interest payable 40 change in other current assets 41 change in other current liabilities 42 change in other working capital 43 dividend paid cfo 44 dividend received cfo 45 interest paid cfo 0 0 1.77 0 83.87 68.76 105.33 105.33 22.48 -3.21 -64 0 0 1.57 0 73.36 -91.32 -48.48 -63.59 -40.15 5.63 42.47 0 42.47 0 - 0- 0 42.47 0 1.41 0 27.69 -34.34 - 10.22 - 1.02 - 70.38 4.82 44.60 44.60 -7.33 -7.33 51.93 0 0 0 1.26 0 20.98 -22.36 -42.62 -47.34 - 12.28 -6.82 14.16 14.16 - 17.73 - 17.73 31.88 -6.33 0 0 0 0 0 0 0 0 0 0 0 0 0 0 0 0 25.20 0 8.17 -50.80 0 0 -3.16 0 0 0 24.46 0 0 0 0 0 0 0 0 A B B D E F 0 0 0 0 0 0 -38.48 -38.48 0 0 0 0 - 70.81 - 70.81 0 - 70.76 - 70.99 0.24 -0.05 -0.05 0 -24.92 -24.92 0 -24.70 -24.70 0 0 0 0 0 - 164.12 - 164.12 0 -52.29 -52.81 0.53 -0.19 -0.19 0 0 0-111.64 0-111.64 -22.94 -25.70 2.77 -0.03 -0.03 0 -0.22 -0.22 0 0 0 0 0 0 0 0 0 0 0 0 0 0 0 0 0 0 0 -379.29 -379.29 0 - 37.40 -37.58 0.17 -0.04 -0.04 0 0-327.36 0 -327.36 0 0 0 0 0 0 0 0 0 0 - 14.49 0 298.01 298.01 345.06 345.06 357.52 - 12.46 0 0 0 31.01 36.69 0 -5.68 46 interest received cfo 47 taxes refund paid 48 cash from discontinued operating activities 49 investing cash flow 50 cash flow from continuing investing activities 51 capital expenditure reported 52 net ppep and sale 53 purchase of ppe 54 sale of ppe 55 net intangibles purchase and sale 56 purchase of intangibles 57 sale of intangibles 58 net business purchase and sale 59 purchase of business 60 sale of business 61 net investment properties purchase and sale 62 purchase of investment properties 63 sale of investment properties 64 net investment purchase and sale 65 purchase of investment 66 sale of investment 67 dividends received cfi 68 interest received cfi 69 net other investing changes 70 cash from discontinued investing activities 71 financing cash flow 72 cash flow from continuing financing activities 73 net issuance payments of debt 74 net long term debt issuance 75 long term debt issuance 76 long term debt payments 77 net short term debt issuance 78 short term debt issuance 79 short term debt payments 80 net common stock issuance 81 common stock issuance 82 common stock payments 83 net preferred stock issuance 84 preferred stock issuance 85 preferred stock payments 86 Cash Dividends paid 87 common stock dividend paid 88 preferred stock dividend paid 89 proceeds from stock option exercised 90 interest paid cff 0 0 0 0 0 0 0 0 0 0 0 0 0 0 0 0 136.97 - 136.97 -106.30 - 106.30 0 0 0 0 - 15.51 . 0 0 0 0 0 0 0 -31.38 -31.38 20.74 20.74 25 -4.26 0 -0.04 -0.04 53.25 53.25 72.14 - 18.89 0 0 ooo 0 0 0 -83.77 -83.77 52.48 52.48 57.60 -5.13 0 0 0 -64.83 1.69 -66.52 0 0 0 0 -68.17 -68.17 0 -106.30 0 0 0 0 0 3.74 3.74 0 0.08 0.08 0 3.02 3.02 0 0 0 0 OOO 0 0 0 -49.44 -49.44 0 -54.15 -54.15 0 -76.42 -76.42 0 0 0 OO -32.16 -32.16 0 0 0 0 0 0 0 0 0 0 0 91 net other financing charges 92 cash from discontinued financing activities 93 cash flow from discontinued operation 94 other cash adjustment inside change in cash 95 end cash position 96 changes in cash 97 Effect of Exchange Rate Changes 98 beginning cash position 99 other cash adjustment outside change in cash LOO income tax paid supplemental data 101 interest paid supplemental data LO2 capital expenditure L03 Issuance of Capital Stock 104 Issuance of Debt 105 Repayment of Debt L06 Repurchase of Capital Stock 107 free cash flow L08 adjusted geography segment data L09 domestic sales 110 foreign sales 111 other non current liabilities 112 total equity gross minority interest 113 stockholders equity 114 capital stock 115 preferred stock 116 common stock 117 other capital stock 118 additional paid in capital 119 retained earnings 120 treasury stock 121 gains losses not affecting retained earnings 122 unrealized gain loss 123 minimum pension liabilities 124 foreign currency translation adjustments 125 fixed assets revaluation reserve 126 other equity adjustments 127 other equity interest 128 Minority Interest 129 total capitalization 130 preferred stock equity 131 common stock equity 132 Capital Lease Obligations 133 net tangible assets 134 working capital 135 invested capital -3.93 -1.64 -3.25 -1 -2.25 0 0 0 0 0 0 0 0 0 0 0 0 55.77 28.23 10.82 -9.94 13.05 27.55 17.33 20.56 -23.45 - 12.18 -0.01 0.08 0.19 0.46 0.35 28.23 10.82 -9.94 13.05 24.88 0 0 0 0 0 0 0 0 0 0 0 0 -25.73 -37.61 - 71.04 -53.01 -24.92 0.08 36.69 1.69 3.02 3.74 72.14 357.52 57.60 25 0 -18.89 - 12.46 -5.13 -4.26 -106.30 0-5.68 -66.52 0 0 40.33 61 104.10 119.05 124.79 0 0 0 0 0 0 0 0 0 0 0 0 0 0 1.01 1.11 1.94 620.14 817.2 797.49 767.83 630.17 620.14 817.2 797.49 767.83 630.17 681.41 680.96 654.31 665.6 653.67 0 0 0 0 0 681.41 680.96 654.31 665.6 653.67 0 0 0 0 0 0 0 0 0 0 -68.55 128.64 152.93 107.38 -24.47 0 0 -8.84 0 0 - 1.11 0.77 -6.71 -9.88 -3.03 0 0 0 0 0 0 0 0 0 0 0 0 0 0 0 0 0 0 0 0 0 0 0 8.4 6.83 5.8 4.72 4 0 0 0 0 0 1745.83 1870.32 1436.92 1348.59 1184.39 0 0 0 0 0 620.14 817.2 797.49 767.83 630.17 150.58 163.16 27.02 14.09 11.91 0 0 0 0 0 502.62 528.89 419.17 371.15 349.66 0 0 0 0 0 o o 136 tangible book value 137 total debt 138 net debt 139 share issued 140 ordinary shares number 141 preferred shares number 142 treasury shares number 0 0 0 0 0 OOOOOOO OOOOOOO - 0 0 0