Question
b) Fit the data to the Freundlich isotherm equation according to the graphical methods presented in class. Show your graph and determine the 1/ n
 b) Fit the data to the Freundlich isotherm equation according to the graphical methods presented in class. Show your graph and determine the 1/n and KF parameters (9 pts).
c) Fit the data to the Langmuir isotherm equation according to the graphical methods presented in class. Show your graph and determine the b and K parameters (9 pts).
d) What is the predicted value of q at maximum adsorption from application of the Langmuir Model (3 pts)?
e) Which model fits the experimental data best? Give reasons for you answer and discuss the major limitations of this model (4 pts)?
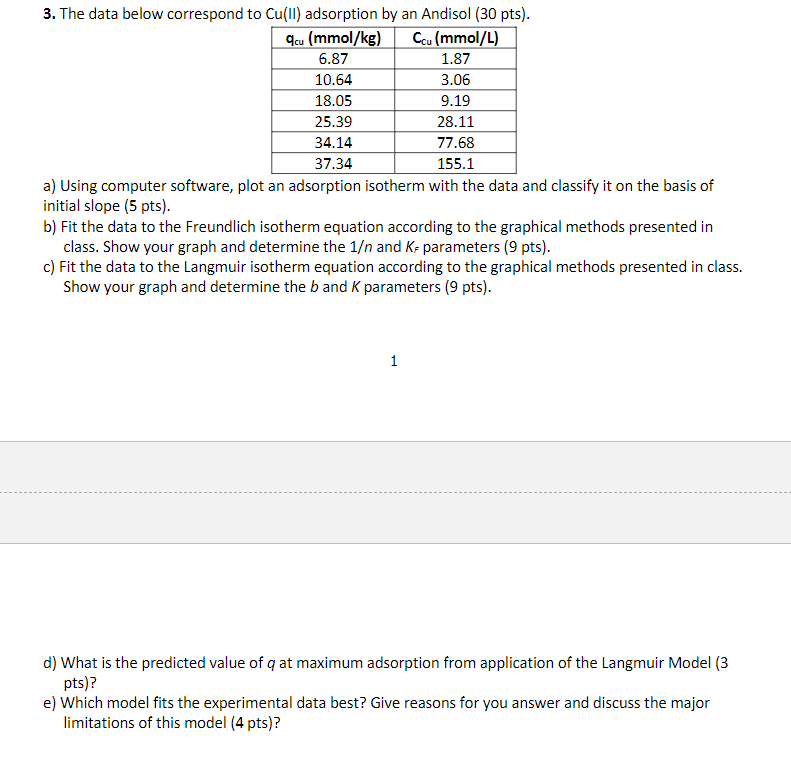
3. The data below correspond to Cu(II) adsorption by an Andisol ( 30pts). a) Using computer software, plot an adsorption isotherm with the data and classify it on the basis of initial slope (5 pts). b) Fit the data to the Freundlich isotherm equation according to the graphical methods presented in class. Show your graph and determine the 1 and KF parameters ( 9 pts). c) Fit the data to the Langmuir isotherm equation according to the graphical methods presented in class. Show your graph and determine the b and K parameters ( 9 pts). 1 d) What is the predicted value of q at maximum adsorption from application of the Langmuir Model (3 pts)? e) Which model fits the experimental data best? Give reasons for you answer and discuss the major limitations of this model ( 4pts)
Step by Step Solution
There are 3 Steps involved in it
Step: 1

Get Instant Access to Expert-Tailored Solutions
See step-by-step solutions with expert insights and AI powered tools for academic success
Step: 2

Step: 3

Ace Your Homework with AI
Get the answers you need in no time with our AI-driven, step-by-step assistance
Get Started


