Answered step by step
Verified Expert Solution
Question
1 Approved Answer
R A one-way analysis of variance experiment produced the following ANOVA table. (You may find it useful to reference the q table). SUMMARY Groupa


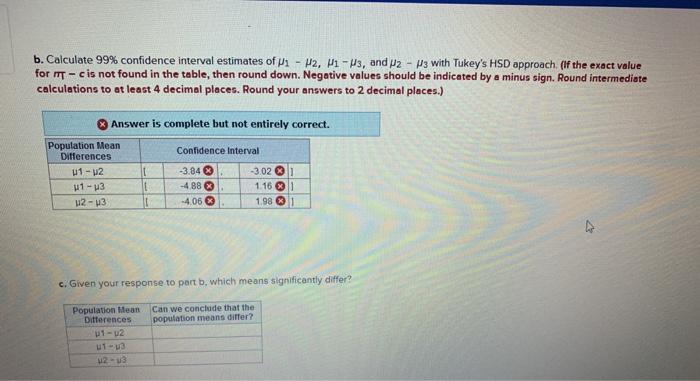
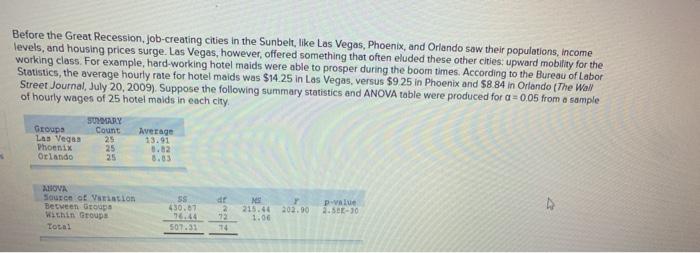
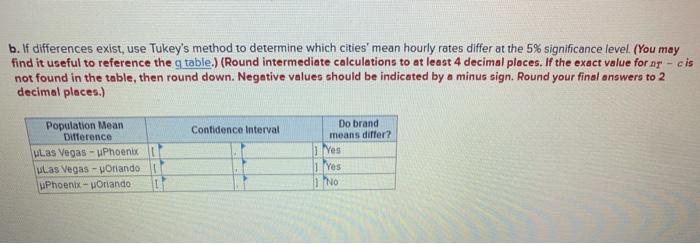
R A one-way analysis of variance experiment produced the following ANOVA table. (You may find it useful to reference the q table). SUMMARY Groupa Column 1 Count Average 0.39 1.21 2.25 p-value 4. Column 2 4. Column 3 Source of Variation Between Groupa Within Groupa SS dr MS 3.84 7.67 6.19 0.0204 S.55 0.62 Total 13.22 11 b. Calculate 99% confidence interval estimates of u for m- cis not found in the table, then round down. Negative values should be indicated by a minus sign. Round intermediate calculations to at least 4 decimal places. Round your answers to 2 decimal places.) - P2. P1 -H3, and uz - P3 with Tukey's HSD approach. (If the exact value Answer is complete but not entirely correct. Population Mean Differences Confidence Interval -3.84 O -4.88 0 -4,06 3 -3.0201 1.16 O) u1-u2 u1- u3 12 - 43 1.98 O1 c. Given your response to part b, which means significantly differ? Population Mean Ditterences Can we conclude that the population means differ? u1-u3 - Before the Great Recession, Job-creating cities in the Sunbelt, like Las Vegas, Phoenix, and Orlando saw their populations, income levels, and housing prices surge. Las Vegas, however, offered something that often eluded these other cities: upward mobility for the working class. For example, hard-working hotel maids were able to prosper during the boom times. According to the Bureau of Labor Statistics, the average hourly rate for hotel maids was $14.25 in Las Vegas, versus $9 25 in Phoenix and $8.84 in Orlando (The Wall Street Journal, July 20, 2009). Suppose the following summary statisties and ANOVA table were produced for a = 005 from a sample of hourly wages of 25 hotel maids in each city Groupa Las Vegaa Phoenix Orlando SUMMARY Count 25 25 25 Average 13.91 0.82 8.03 AHOVA Source of Vaiation Betveen Groupa Within Groups SS 430.07 76.44 507.31 dr 215.44 1.06 202.90 Pvalue 2.SeE-30 Total 74 b. If differences exist, use Tukey's method to determine which cities' mean hourly rates differ at the 5% significance level. (You may find it useful to reference the q table.) (Round intermediate calculations to at least 4 decimal places. If the exact value for nr - cis not found in the table, then round down. Negative values should be indicated by a minus sign. Round your final answers to 2 decimal places.) Population Mean Difference Do brand Contidence Interval means differ? HLas Vegas - uPhoenix ULas Vegas - uoriando uPhoenix - uOriando Yes 1 Yes No
Step by Step Solution
There are 3 Steps involved in it
Step: 1
The 99 cI for MM i5 with Tukey HSD approach s 9 Vea 31 ...
Get Instant Access to Expert-Tailored Solutions
See step-by-step solutions with expert insights and AI powered tools for academic success
Step: 2

Step: 3

Ace Your Homework with AI
Get the answers you need in no time with our AI-driven, step-by-step assistance
Get Started


