Answered step by step
Verified Expert Solution
Question
1 Approved Answer
b . If we cut and paste most of the above code back into an editing window and change all 2 0 ' s to
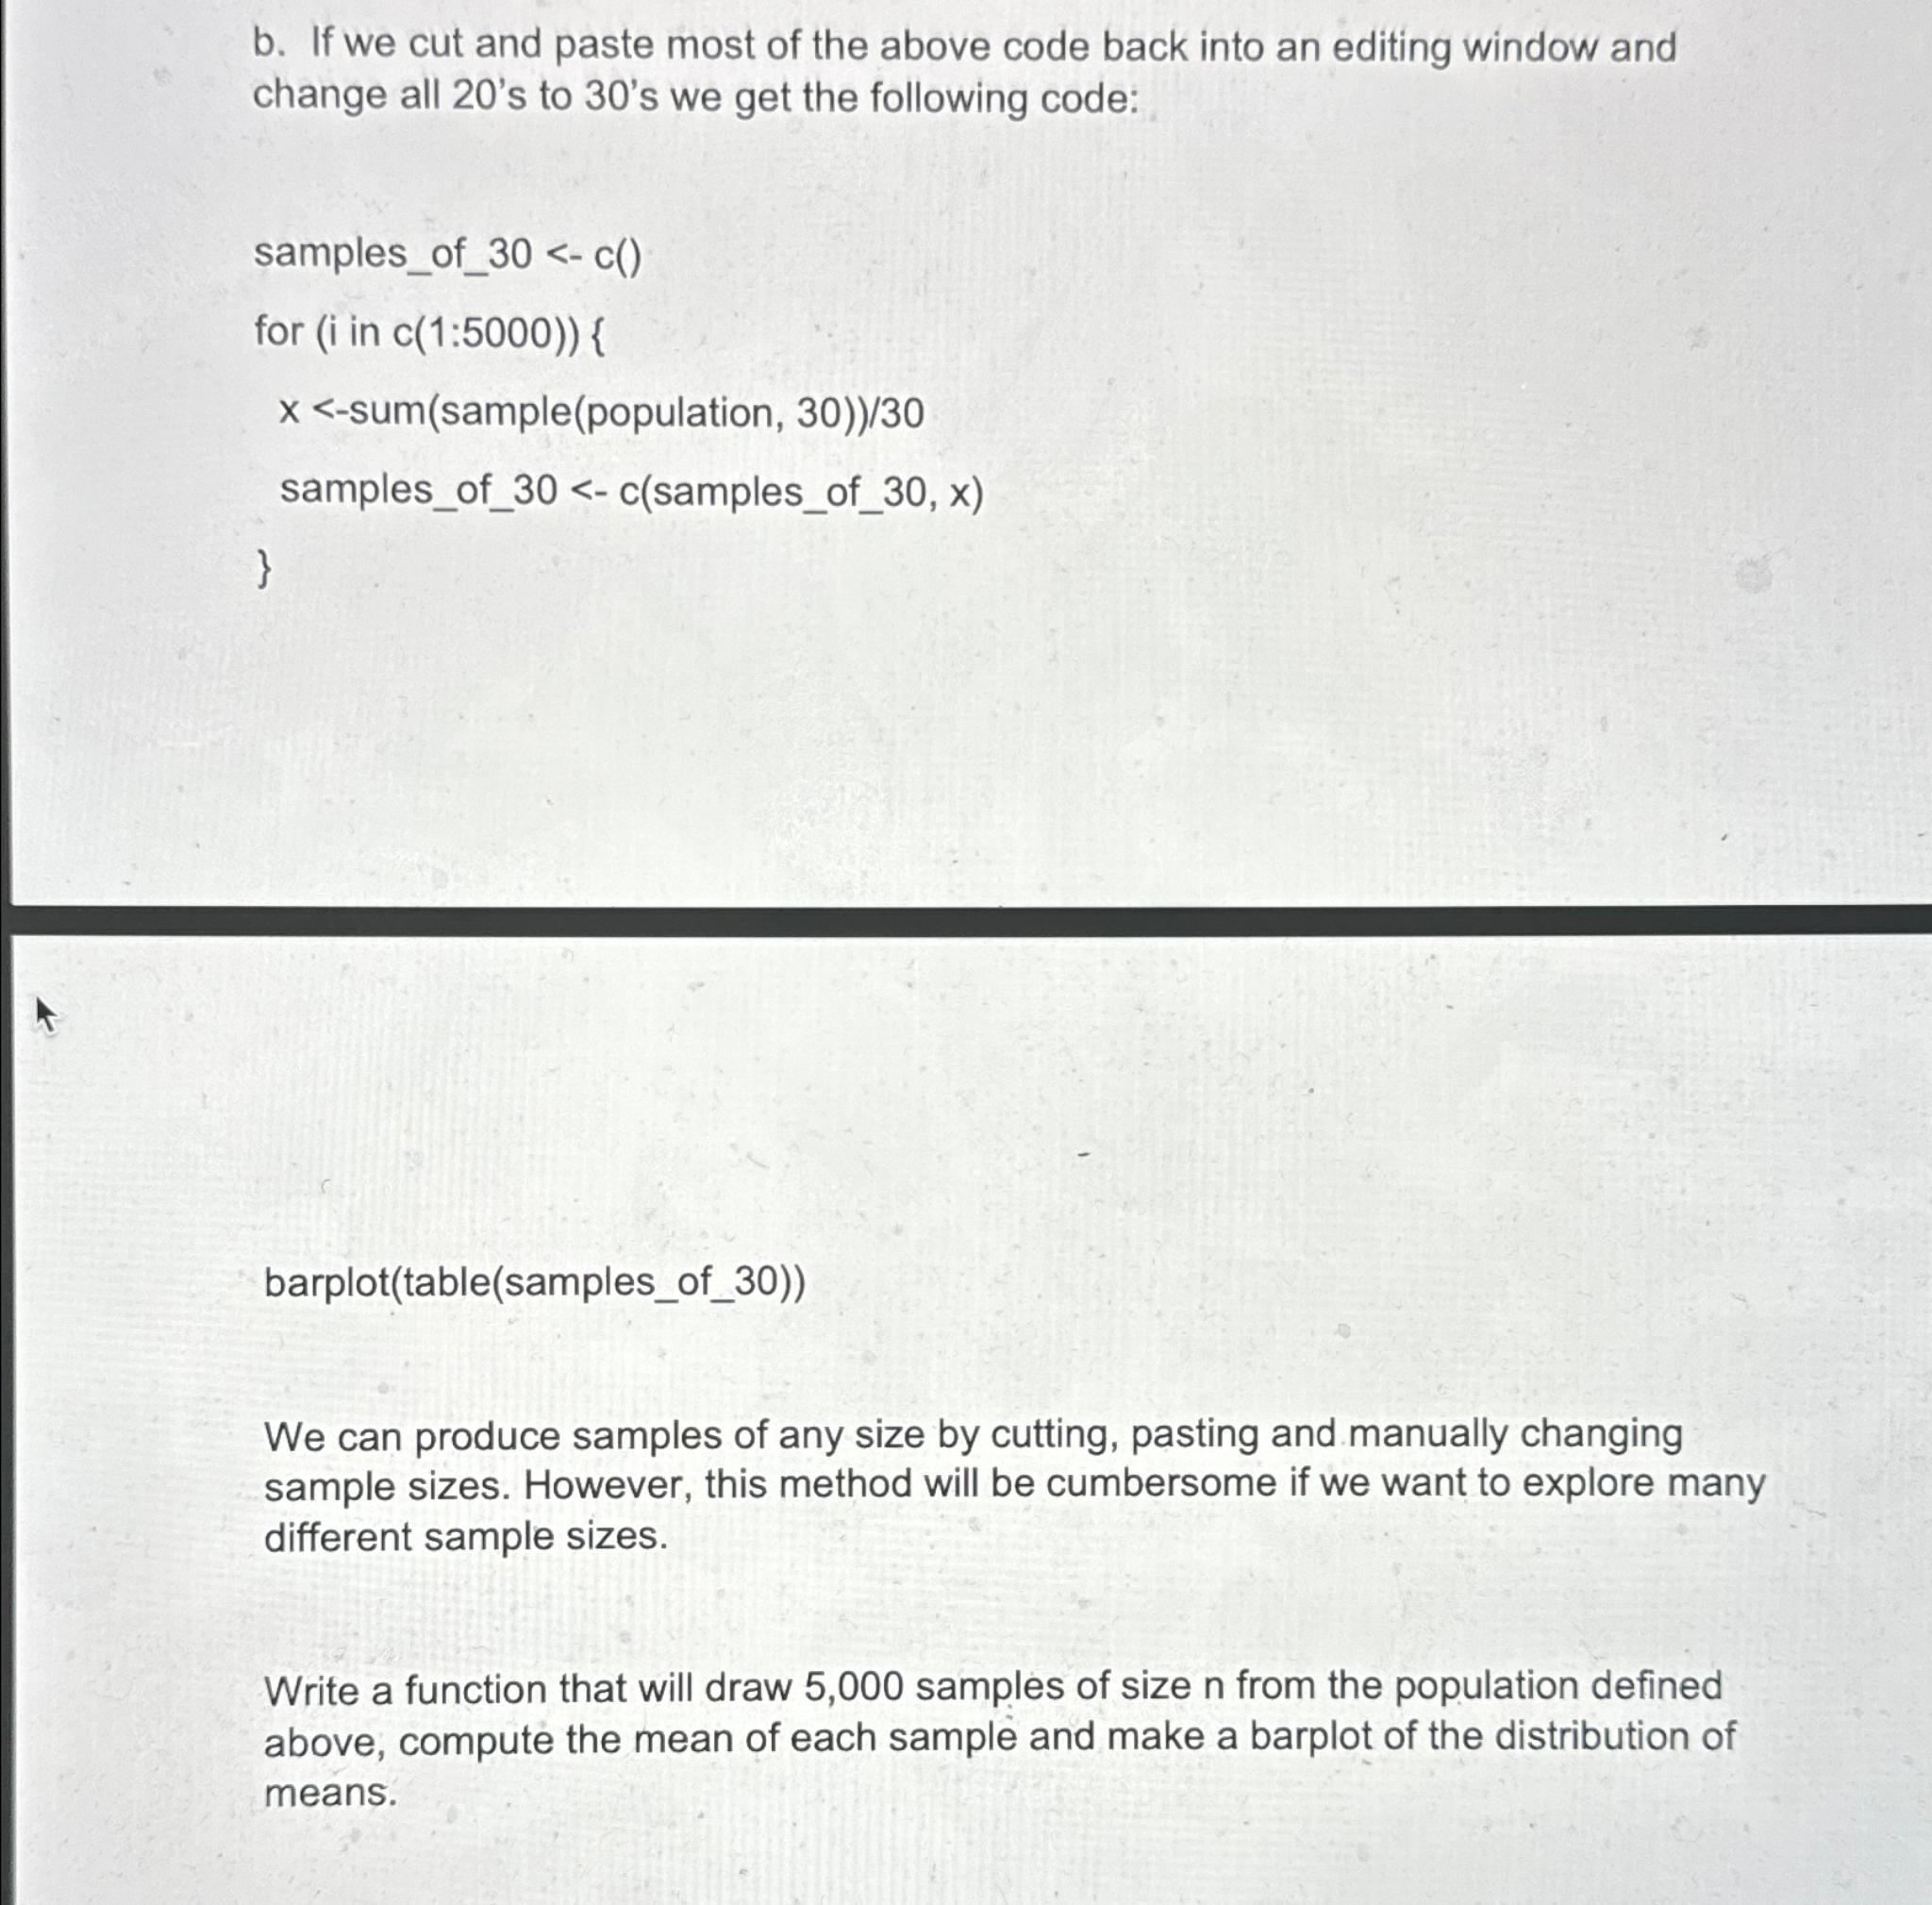
b If we cut and paste most of the above code back into an editing window and change all s to s we get the following code:
samplesofc
for in :
sumsamplepopulation
samplesofcsamplesof
barplottablesamplesof
We can produce samples of any size by cutting, pasting and manually changing sample sizes. However, this method will be cumbersome if we want to explore many different sample sizes.
Write a function that will draw samples of size from the population defined above, compute the mean of each sample and make a barplot of the distribution of means.
Step by Step Solution
There are 3 Steps involved in it
Step: 1

Get Instant Access to Expert-Tailored Solutions
See step-by-step solutions with expert insights and AI powered tools for academic success
Step: 2

Step: 3
Ace Your Homework with AI
Get the answers you need in no time with our AI-driven, step-by-step assistance
Get Started