Answered step by step
Verified Expert Solution
Question
1 Approved Answer
(b) Investors in stocks have different appetites for risk. Data on 24 monthly returns, yt, of an airline stock are collected in parallel with

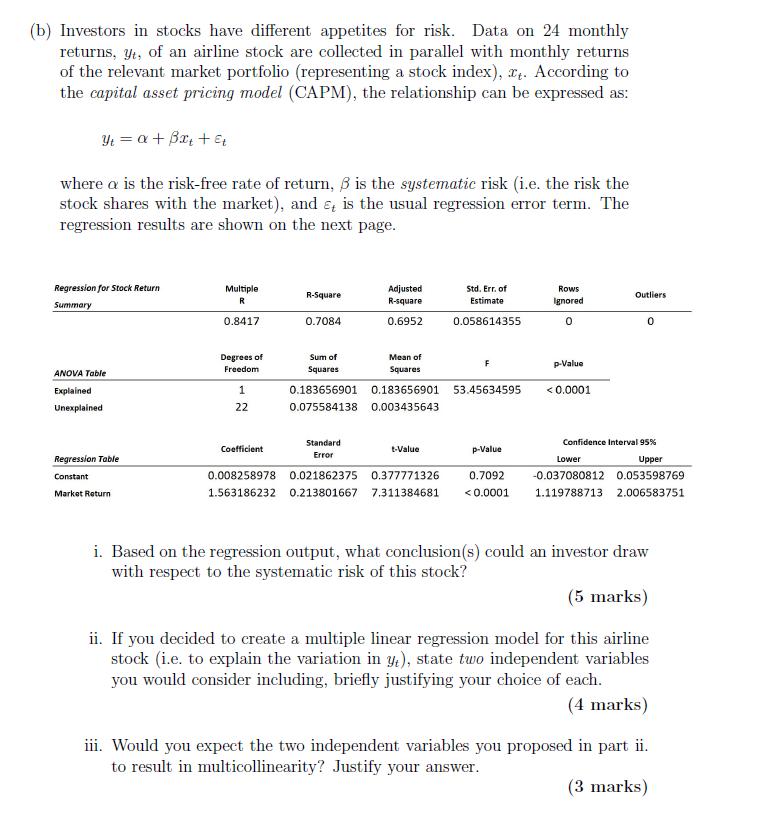
(b) Investors in stocks have different appetites for risk. Data on 24 monthly returns, yt, of an airline stock are collected in parallel with monthly returns of the relevant market portfolio (representing a stock index), x. According to the capital asset pricing model (CAPM), the relationship can be expressed as: Yt = a + Bxt + et where a is the risk-free rate of return, is the systematic risk (i.e. the risk the stock shares with the market), and is the usual regression error term. The regression results are shown on the next page. Regression for Stock Return Summary ANOVA Table Explained Unexplained Regression Table Constant Market Return Multiple R 0.8417 Degrees of Freedom 1 22 Coefficient R-Square 0.7084 Sum of Squares Adjusted R-square 0.6952 Standard Error Mean of Squares 0.183656901 0.183656901 0.075584138 0.003435643 t-Value Std. Err. of Estimate 0.058614355 F 53.45634595 p-Value 0.008258978 0.021862375 0.377771326 0.7092 1.563186232 0.213801667 7.311384681
Step by Step Solution
★★★★★
3.41 Rating (157 Votes )
There are 3 Steps involved in it
Step: 1
i Based on the regression output an investor can draw the following conclusions regarding the systematic risk of this stock The coefficient of the Market Return variable is 02138 The pvalue associated ...
Get Instant Access to Expert-Tailored Solutions
See step-by-step solutions with expert insights and AI powered tools for academic success
Step: 2

Step: 3

Ace Your Homework with AI
Get the answers you need in no time with our AI-driven, step-by-step assistance
Get Started


