Answered step by step
Verified Expert Solution
Question
1 Approved Answer
(b) Manager Fiona Channing of Fabrics Mill, Inc., has developed the forecast and level plan for bolts of cloth shown in the Table Q1.

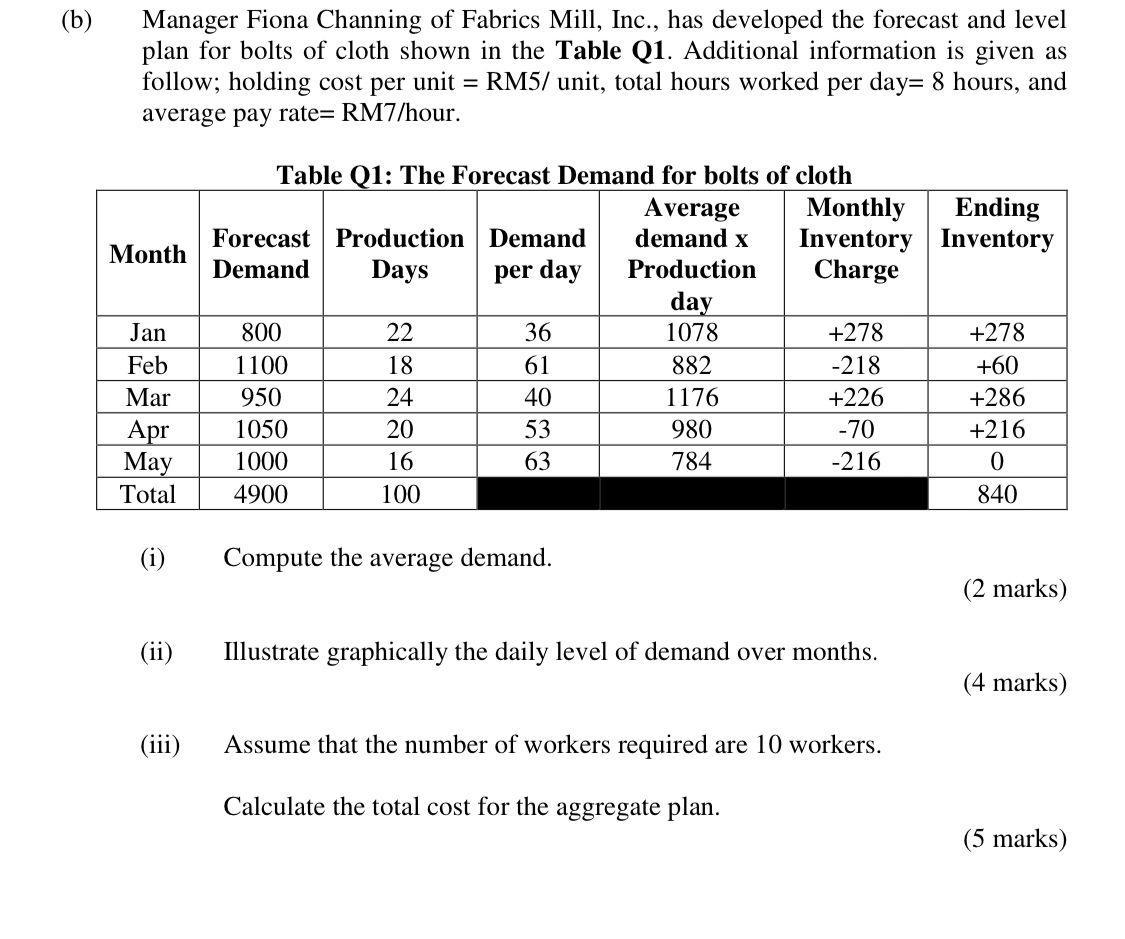
(b) Manager Fiona Channing of Fabrics Mill, Inc., has developed the forecast and level plan for bolts of cloth shown in the Table Q1. Additional information is given as follow; holding cost per unit = RM5/ unit, total hours worked per day= 8 hours, and average pay rate= RM7/hour. Table Q1: The Forecast Demand for bolts of cloth Month Forecast Demand Production Demand Average demand x Monthly Ending Inventory Inventory Days per day Production Charge day Jan 800 22 36 1078 +278 +278 Feb 1100 18 61 882 -218 +60 Mar 950 24 40 1176 +226 +286 Apr 1050 20 53 980 -70 +216 May 1000 16 63 784 -216 0 Total 4900 100 840 (i) Compute the average demand. (ii) Illustrate graphically the daily level of demand over months. (iii) Assume that the number of workers required are 10 workers. Calculate the total cost for the aggregate plan. (2 marks) (4 marks) (5 marks)
Step by Step Solution
There are 3 Steps involved in it
Step: 1

Get Instant Access to Expert-Tailored Solutions
See step-by-step solutions with expert insights and AI powered tools for academic success
Step: 2

Step: 3

Ace Your Homework with AI
Get the answers you need in no time with our AI-driven, step-by-step assistance
Get Started


