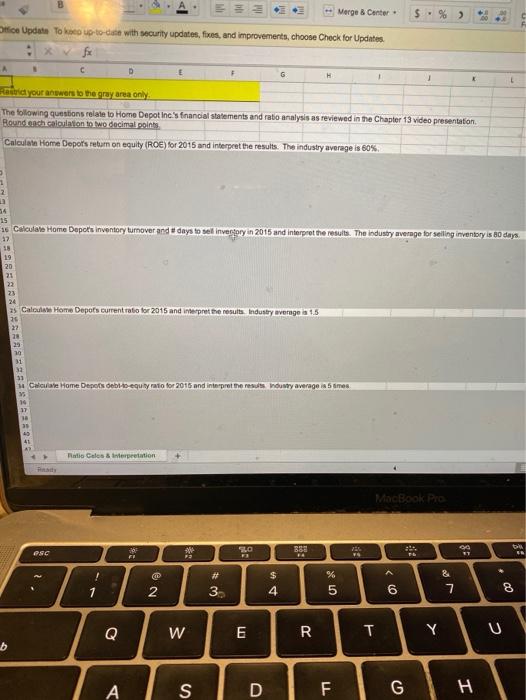
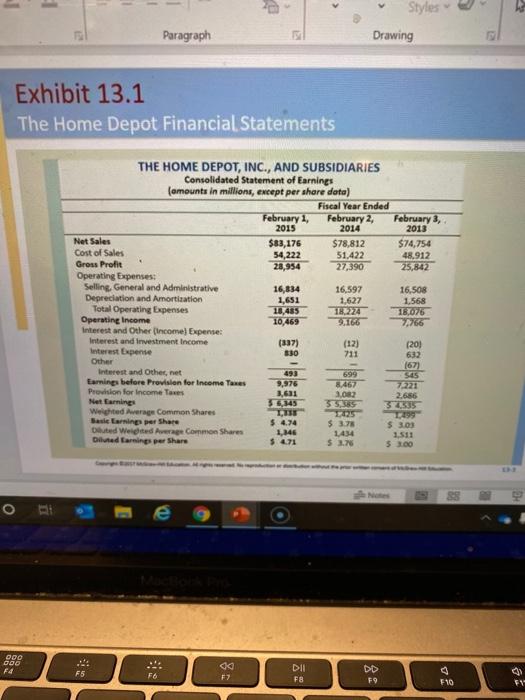
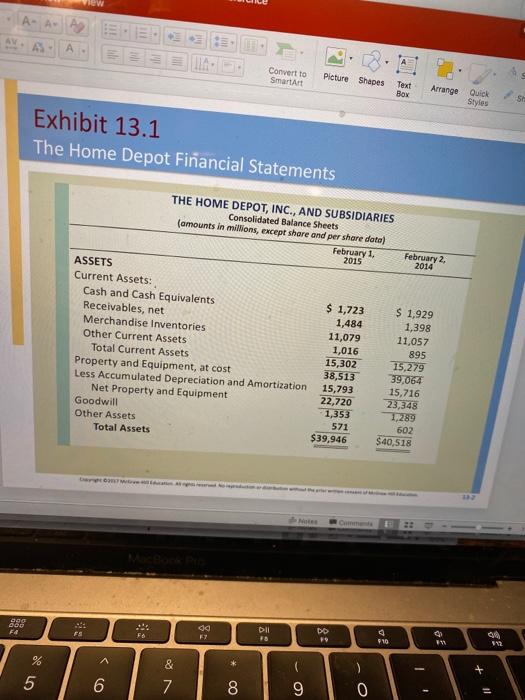
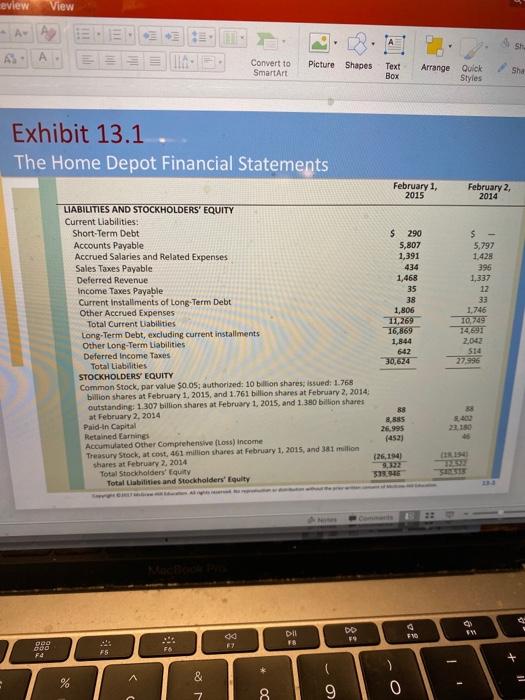
B Morge & Center $ % Office Update To co up to date with security updates, foxes and improvements, choose Check for Updates fx D G H Resurid your awers to the gray area only The following questions relate to Home Depot Inc.'s financial statements and ratio analysis as reviewed in the Chapter 13 video presentation Round each calculation to two decimal points Calculan Home Depot's rebum on equity (ROE) for 2015 and interpret the results. The industry average is 60% 1 2 15 16 Calculato Home Depot's inventory turnover and #days to sell invertory in 2015 and interpret the results. The Industry average for selling inventory is 80 days 32 18 19 20 21 23 25 Calon Home Depots current ratio for 2015 and interpret the results industry average 15 20 27 20 29 30 31 - Calculates Home Depot deb equity rato for 2015 and interpret the results industry average i5 times 17 Titio Celestepretation MacBook Pro 30 esc 883 EL TE so F" 12 ! # 2 $ 4 % 5 & 7 3 6 8 Q W E R T Y A S D F G H Styles Drawing Paragraph Exhibit 13.1 The Home Depot Financial Statements THE HOME DEPOT, INC., AND SUBSIDIARIES Consolidated Statement of Earnings (amounts in millions, except per share data) Fiscal Year Ended February 1, February 2 February 2015 2014 2013 Net Sales $83,176 $78,812 $74,754 Cost of Sales 54,222 51.422 48.912 Gross Profit 28,954 27,390 25,842 Operating Expenses: Selling General and Administrative 16,834 16,597 16,508 Depreciation and Amortization 1,651 1,627 1.568 Total Operating Expenses 18,455 18.224 18,076 Operating Income 10,469 9.166 7,766 Interest and Other (Income) Expenses Interest and investment Income (337) (12) (20) Interest Expense 630 632 Other (67) Interest and Othernet 493 699 505 Earnings before Provision for Income Taxes 9,976 87467 7221 Pression for Income Taxes 3.631 3,082 2.686 Net Earnings 5415 3535 3735 Weighted Average Common Shares LU Basilarning per Share $.4.74 $ 3.78 $ 3.03 Duted Welded Page Common Shares 1,346 1434 Diled Earning per Share 1.511 $ 471 $ 3.76 53.00 711 O 000 COD F4 Sony FS F DII F8 DD F9 F10 FT A- A A Convert to SmartArt Picture Shapes Text Box Arrange Quick Styles SH Exhibit 13.1 The Home Depot Financial Statements THE HOME DEPOT, INC., AND SUBSIDIARIES Consolidated Balance Sheets (amounts in millions, except share and per share data) February 1, 2015 February 2, 2014 ASSETS Current Assets: Cash and Cash Equivalents Receivables, net Merchandise Inventories Other Current Assets Total Current Assets Property and Equipment, at cost Less Accumulated Depreciation and Amortization Net Property and Equipment Goodwill Other Assets Total Assets $ 1,723 1,484 11,079 1,016 15,302 38,513 15,793 22,720 1,353 571 $39.946 $ 1,929 1,398 11,057 895 15,279 39,064 15,716 23,348 1,289 602 $40,518 20 400 F# da FS DII 73 DD & FS 41 112 & 5 6 7 8 00 9 0 1 eview View Convert to SmartArt Picture Shapes Text Box Arrange Quick Styles Sha Exhibit 13.1 The Home Depot Financial Statements February 2, 2014 February 1, 2015 LIABILITIES AND STOCKHOLDERS' EQUITY Current Liabilities: Short-Term Debt $ 290 Accounts Payable 5,807 Accrued Salaries and Related Expenses 1,391 Sales Taxes Payable 434 Deferred Revenue 1,468 Income Taxes Payable 35 Current installments of Long-Term Debt 38 Other Accrued Expenses 1,806 Total Current abilities 10269 Long-Term Debt, excluding current installments 16,869 Other Long-Term Liabilities 1,844 Deferred Income Taxes 642 Total Liabilities 30,624 STOCKHOLDERS' EQUITY Common Stock, par value $0.05, authorized: 10 billion shares; issued: 1.768 billion shares at February 1, 2015, and 1.761 billion shares at February 2, 2014 outstanding: 1 307 billion shares at February 1, 2015 and 1.380 billion shares 88 at February 2, 2014 Paid-in Capital 8.885 26.995 Retained Earnings (452) Accumulated Other Comprehensive (Loss) income Treasury Stock, at cost, 461 million shares at February 1, 2015, and 381 million (26,194) shares at February 2, 2014 Total Stockholders' Equity 31 Total Liabilities and Stockholders' Equity s 5,797 1.428 396 1,337 12 38 1.746 10.09 14.691 2043 27.996 2310 00 DII DD 9 110 ODO FA F5 F6 + % & 9 0 7 ac