Answered step by step
Verified Expert Solution
Question
1 Approved Answer
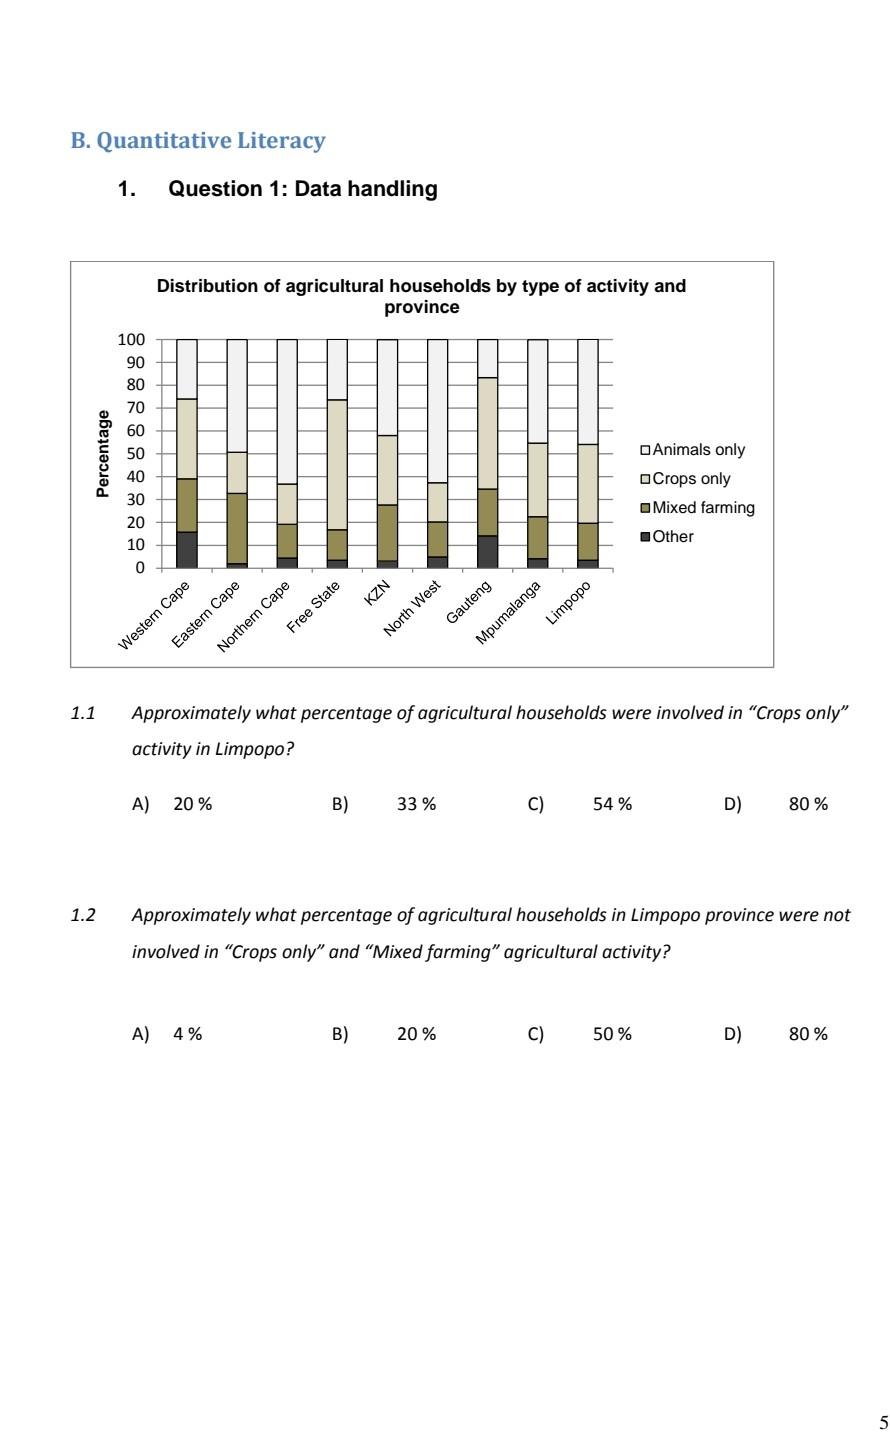
B. Quantitative Literacy 1. Question 1: Data handling Distribution of agricultural households by type of activity and province Percentage 100 90 80 70 60 50

B. Quantitative Literacy 1. Question 1: Data handling Distribution of agricultural households by type of activity and province Percentage 100 90 80 70 60 50 40 30 20 10 Animals only Crops only Mixed farming Other 0 Free State KZN Gauteng Limpopo North West Western Cape Eastern Cape Northern Cape Mpumalanga 1.1 Approximately what percentage of agricultural households were involved in "Crops only" activity in Limpopo? A) 20% B) 33% C) 54 % D) 80 % 1.2 Approximately what percentage of agricultural households in Limpopo province were not involved in "Crops only and Mixed farming" agricultural activity? A) 4% B) 20 % C) 50 % D) 80% 5
Step by Step Solution
There are 3 Steps involved in it
Step: 1

Get Instant Access to Expert-Tailored Solutions
See step-by-step solutions with expert insights and AI powered tools for academic success
Step: 2

Step: 3

Ace Your Homework with AI
Get the answers you need in no time with our AI-driven, step-by-step assistance
Get Started


