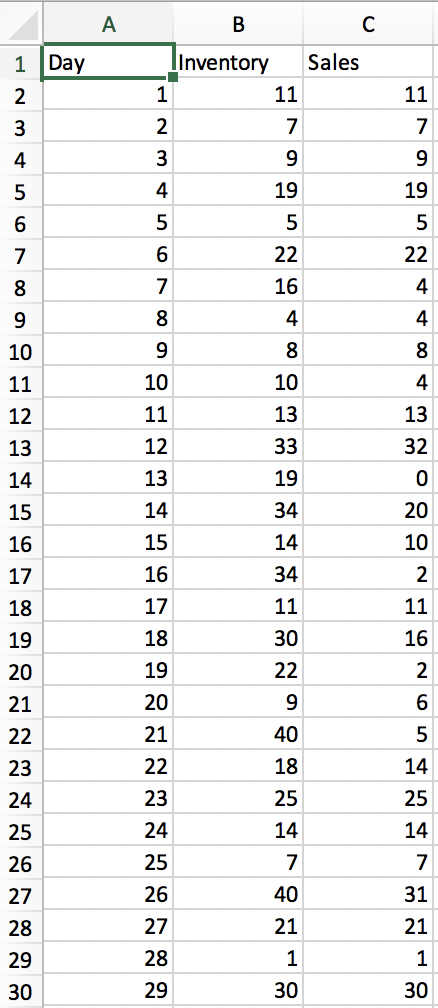
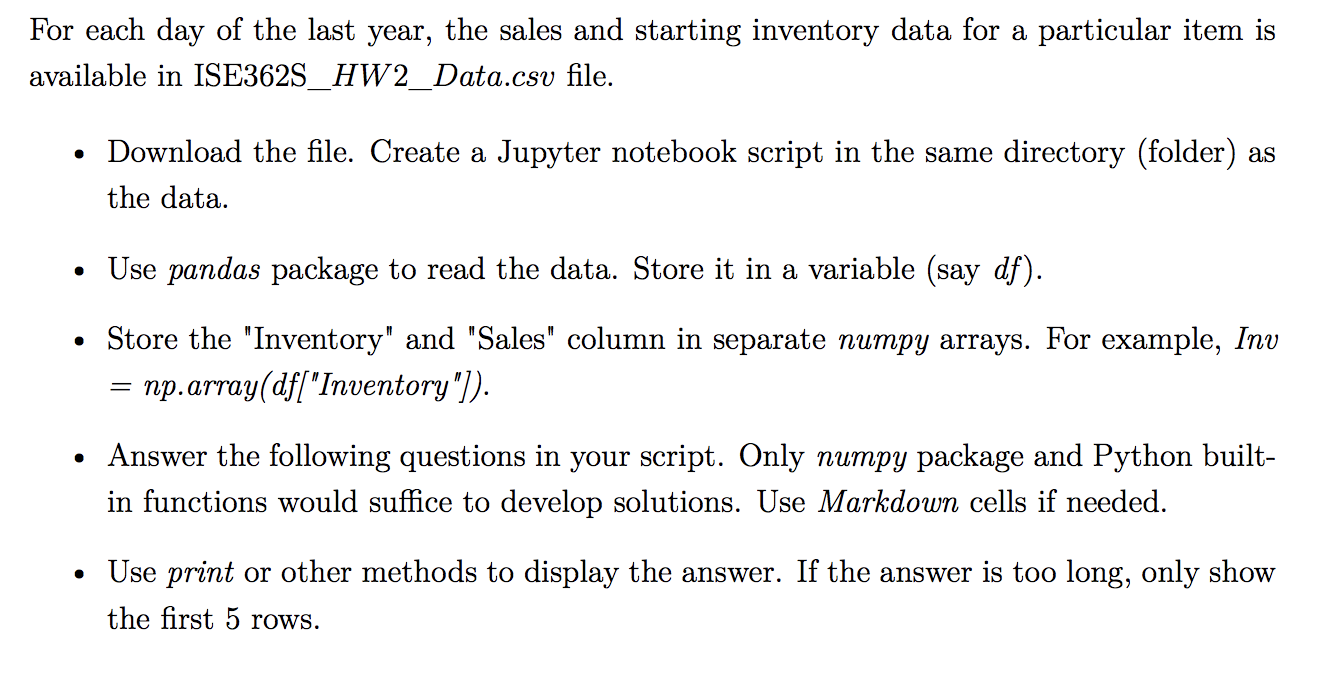
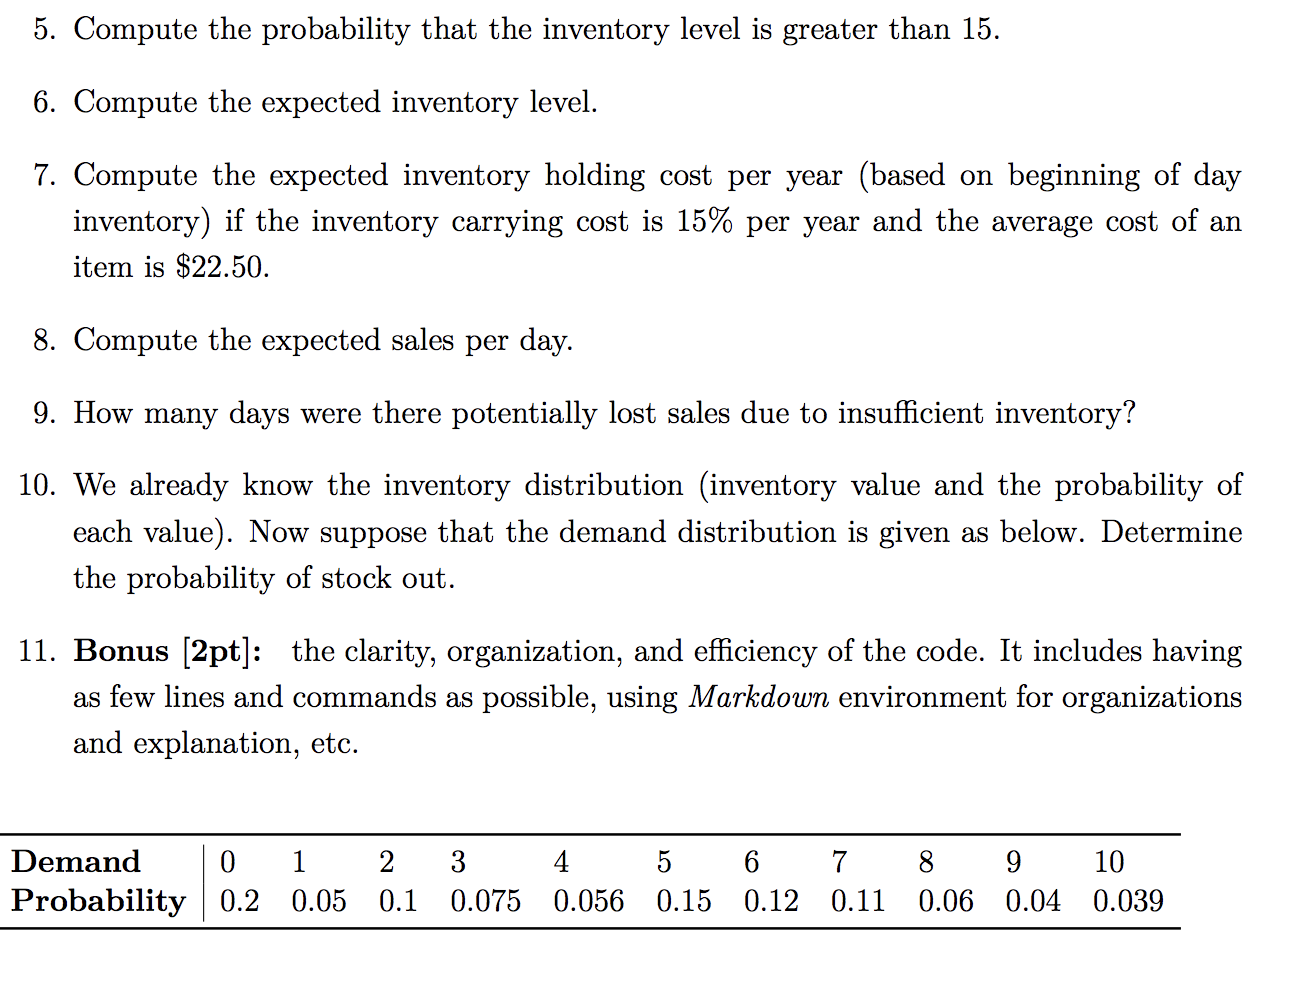
B Sales Day lInventory 1 11 7 9 Nm 2 Nm 0 0 0 11 7 9 19 5 22 4 19 5 5 6 22 7 16 4 8 4 4 8 8 8 4 10 10 11 a 12 10 10 13 to 33 13 10. 11 11 12 12 13 to 14 17 15 15 16 10 17 1 18. 10 19 19 14 +7 15 19 34 07 14 17 34 13 10 32 0 o 20 10 2. 11 11 16 16 17 11 18 19 2 20 5 21 -- 22 23 so 24 - 25 . 6 5 14 25 14 7 31 21 1 30 40 21 28 29 30 For each day of the last year, the sales and starting inventory data for a particular item is available in ISE362S_HW2_Data.csv file. Download the file. Create a Jupyter notebook script in the same directory (folder) as the data. 0 Use pandas package to read the data. Store it in a variable (say df). 0 Store the "Inventory" and "Sales" column in separate numpy arrays. For example, Inv np.array(df["Inventory"]). = Answer the following questions in your script. Only numpy package and Python built- in functions would suffice to develop solutions. Use Markdown cells if needed. Use print or other methods to display the answer. If the answer is too long, only show the first 5 rows. 5. Compute the probability that the inventory level is greater than 15. 6. Compute the expected inventory level. 7. Compute the expected inventory holding cost per year (based on beginning of day inventory) if the inventory carrying cost is 15% per year and the average cost of an item is $22.50. 8. Compute the expected sales per day. 9. How many days were there potentially lost sales due to insufficient inventory? 10. We already know the inventory distribution (inventory value and the probability of each value). Now suppose that the demand distribution is given as below. Determine the probability of stock out. 11. Bonus [2pt]: the clarity, organization, and efficiency of the code. It includes having as few lines and commands as possible, using Markdown environment for organizations and explanation, etc. Demand 0 1 2 3 4 5 6 7 Probability 0.2 0.05 0.1 0.075 0.056 0.15 0.12 0.11 8 9 10 0.06 0.04 0.039 B Sales Day lInventory 1 11 7 9 Nm 2 Nm 0 0 0 11 7 9 19 5 22 4 19 5 5 6 22 7 16 4 8 4 4 8 8 8 4 10 10 11 a 12 10 10 13 to 33 13 10. 11 11 12 12 13 to 14 17 15 15 16 10 17 1 18. 10 19 19 14 +7 15 19 34 07 14 17 34 13 10 32 0 o 20 10 2. 11 11 16 16 17 11 18 19 2 20 5 21 -- 22 23 so 24 - 25 . 6 5 14 25 14 7 31 21 1 30 40 21 28 29 30 For each day of the last year, the sales and starting inventory data for a particular item is available in ISE362S_HW2_Data.csv file. Download the file. Create a Jupyter notebook script in the same directory (folder) as the data. 0 Use pandas package to read the data. Store it in a variable (say df). 0 Store the "Inventory" and "Sales" column in separate numpy arrays. For example, Inv np.array(df["Inventory"]). = Answer the following questions in your script. Only numpy package and Python built- in functions would suffice to develop solutions. Use Markdown cells if needed. Use print or other methods to display the answer. If the answer is too long, only show the first 5 rows. 5. Compute the probability that the inventory level is greater than 15. 6. Compute the expected inventory level. 7. Compute the expected inventory holding cost per year (based on beginning of day inventory) if the inventory carrying cost is 15% per year and the average cost of an item is $22.50. 8. Compute the expected sales per day. 9. How many days were there potentially lost sales due to insufficient inventory? 10. We already know the inventory distribution (inventory value and the probability of each value). Now suppose that the demand distribution is given as below. Determine the probability of stock out. 11. Bonus [2pt]: the clarity, organization, and efficiency of the code. It includes having as few lines and commands as possible, using Markdown environment for organizations and explanation, etc. Demand 0 1 2 3 4 5 6 7 Probability 0.2 0.05 0.1 0.075 0.056 0.15 0.12 0.11 8 9 10 0.06 0.04 0.039