Question
b) Solve with the assumption that neither of the population mean nor the population standard deviation is known. 4. The following scores represent the final

b) Solve with the assumption that neither of the population mean nor the population standard deviation is known.
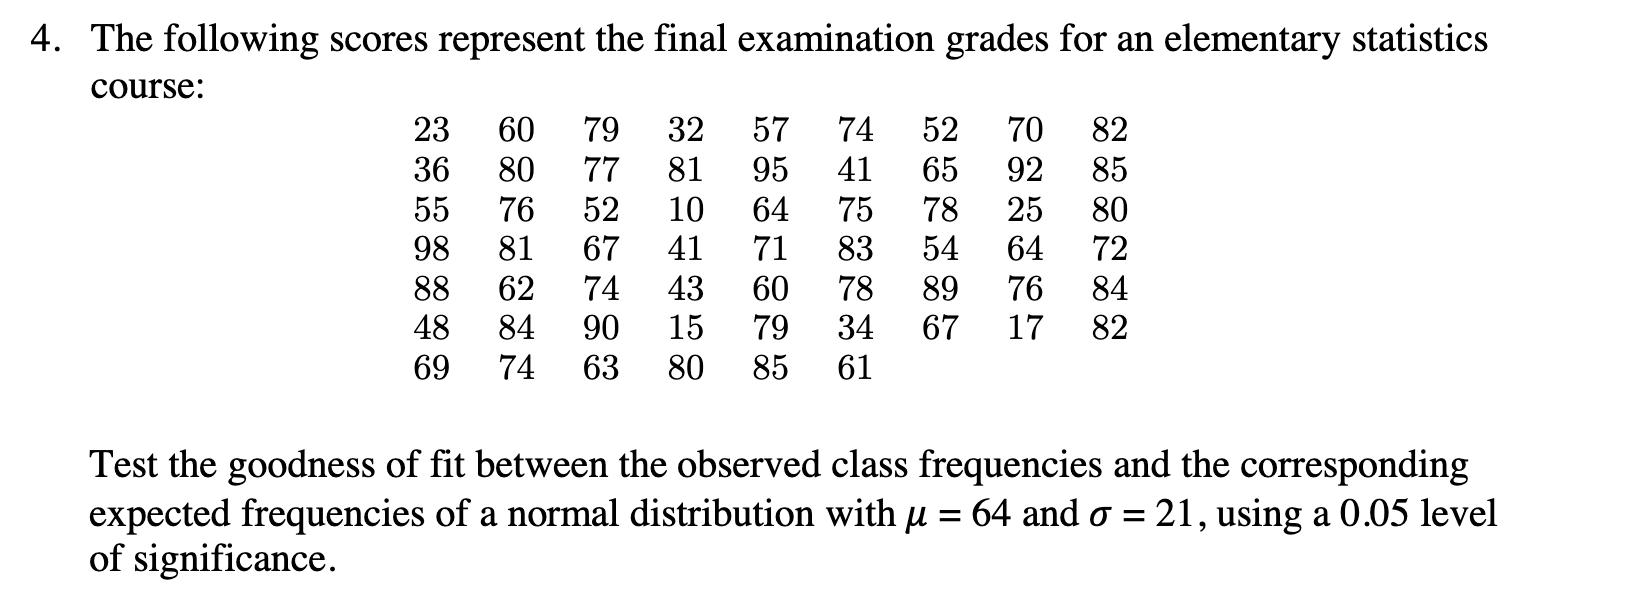
4. The following scores represent the final examination grades for an elementary statistics course: 23 60 79 57 74 52 70 82 36 80 77 95 41 65 92 85 55 76 52 64 75 78 25 80 98 81 67 71 83 54 64 72 88 62 74 60 78 89 76 84 48 84 90 79 34 67 17 82 69 74 63 85 61 Test the goodness of fit between the observed class frequencies and the corresponding expected frequencies of a normal distribution with = 64 and o = 21, using a 0.05 level of significance. 32 1 10 1 43 15 80 81 41
Step by Step Solution
3.48 Rating (151 Votes )
There are 3 Steps involved in it
Step: 1
Solution b Frequency Distribution Table Class Count 1025 5 2641 5 4257 7 5873 14 7489 25 90...
Get Instant Access to Expert-Tailored Solutions
See step-by-step solutions with expert insights and AI powered tools for academic success
Step: 2

Step: 3

Ace Your Homework with AI
Get the answers you need in no time with our AI-driven, step-by-step assistance
Get StartedRecommended Textbook for
Essentials Of Probability And Statistics For Engineers And Scientists
Authors: Ronald E. Walpole, Raymond Myers, Sharon L. Myers, Keying E. Ye
1st Edition
0321783735, 978-0321783738
Students also viewed these Accounting questions
Question
Answered: 1 week ago
Question
Answered: 1 week ago
Question
Answered: 1 week ago
Question
Answered: 1 week ago
Question
Answered: 1 week ago
Question
Answered: 1 week ago
Question
Answered: 1 week ago
Question
Answered: 1 week ago
Question
Answered: 1 week ago
Question
Answered: 1 week ago
Question
Answered: 1 week ago
Question
Answered: 1 week ago
Question
Answered: 1 week ago
Question
Answered: 1 week ago
Question
Answered: 1 week ago
Question
Answered: 1 week ago
Question
Answered: 1 week ago
Question
Answered: 1 week ago
Question
Answered: 1 week ago
Question
Answered: 1 week ago
Question
Answered: 1 week ago
Question
Answered: 1 week ago
Question
Answered: 1 week ago
View Answer in SolutionInn App


