Question
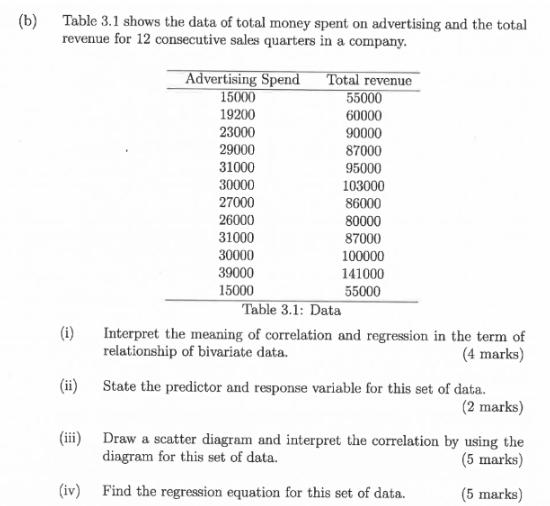
(b) Table 3.1 shows the data of total money spent on advertising and the total revenue for 12 consecutive sales quarters in a company.

(b) Table 3.1 shows the data of total money spent on advertising and the total revenue for 12 consecutive sales quarters in a company. (i) (ii) Advertising Spend 15000 19200 23000 29000 31000 30000 27000 26000 31000 30000 39000 15000 Total revenue 55000 60000 90000 87000 95000 103000 86000 80000 87000 100000 141000 55000 Table 3.1: Data Interpret the meaning of correlation and regression in the term of relationship of bivariate data. (4 marks) State the predictor and response variable for this set of data. (2 marks) (iii) Draw a scatter diagram and interpret the correlation by using the diagram for this set of data. (5 marks) (iv) Find the regression equation for this set of data. (5 marks)
Step by Step Solution
3.48 Rating (145 Votes )
There are 3 Steps involved in it
Step: 1

Get Instant Access to Expert-Tailored Solutions
See step-by-step solutions with expert insights and AI powered tools for academic success
Step: 2

Step: 3

Ace Your Homework with AI
Get the answers you need in no time with our AI-driven, step-by-step assistance
Get StartedRecommended Textbook for
Microeconomics
Authors: Douglas Bernheim, Michael Whinston
2nd edition
73375853, 978-0073375854
Students also viewed these Accounting questions
Question
Answered: 1 week ago
Question
Answered: 1 week ago
Question
Answered: 1 week ago
Question
Answered: 1 week ago
Question
Answered: 1 week ago
Question
Answered: 1 week ago
Question
Answered: 1 week ago
Question
Answered: 1 week ago
Question
Answered: 1 week ago
Question
Answered: 1 week ago
Question
Answered: 1 week ago
Question
Answered: 1 week ago
Question
Answered: 1 week ago
Question
Answered: 1 week ago
Question
Answered: 1 week ago
Question
Answered: 1 week ago
Question
Answered: 1 week ago
Question
Answered: 1 week ago
Question
Answered: 1 week ago
Question
Answered: 1 week ago
View Answer in SolutionInn App


