Answered step by step
Verified Expert Solution
Link Copied!

Question

1 Approved Answer

b. The oxygen binding curves for various conditions are shown. Use the graph to estimate the KD 's for each curve. c. What does the
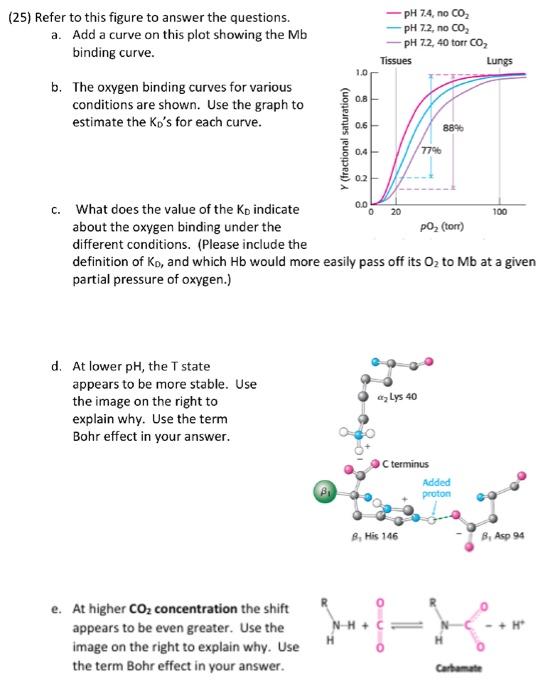
image text in transcribed
b. The oxygen binding curves for various conditions are shown. Use the graph to estimate the KD 's for each curve. c. What does the value of the KD indicate about the oxygen binding under the different conditions. (Please include the definition of KD, and which Hb would more easily pass off its O2 to Mb at a given partial pressure of oxygen.) d. At lower pH, the T state appears to be more stable. Use the image on the right to explain why. Use the term Bohr effect in your answer. e. At higher CO2 concentration the shift appears to be even greater. Use the image on the right to explain why. Use the term Bohr effect in your

Step by Step Solution

There are 3 Steps involved in it

Step: 1

blur-text-image

Get Instant Access to Expert-Tailored Solutions

See step-by-step solutions with expert insights and AI powered tools for academic success

Step: 2

blur-text-image_2

Step: 3

blur-text-image_3

Ace Your Homework with AI

Get the answers you need in no time with our AI-driven, step-by-step assistance

Get Started

Recommended Textbook for

Understanding NMR Spectroscopy

Authors: James Keeler

2nd edition

470746084, 978-0470746097, 470746092, 978-0470746080

More Books

Students also viewed these Chemistry questions