

Answered step by step
Verified Expert Solution
Question
1 Approved Answer
b) Use the picture you created in part (a) to fill in the chart below with the new range of scores for each letter
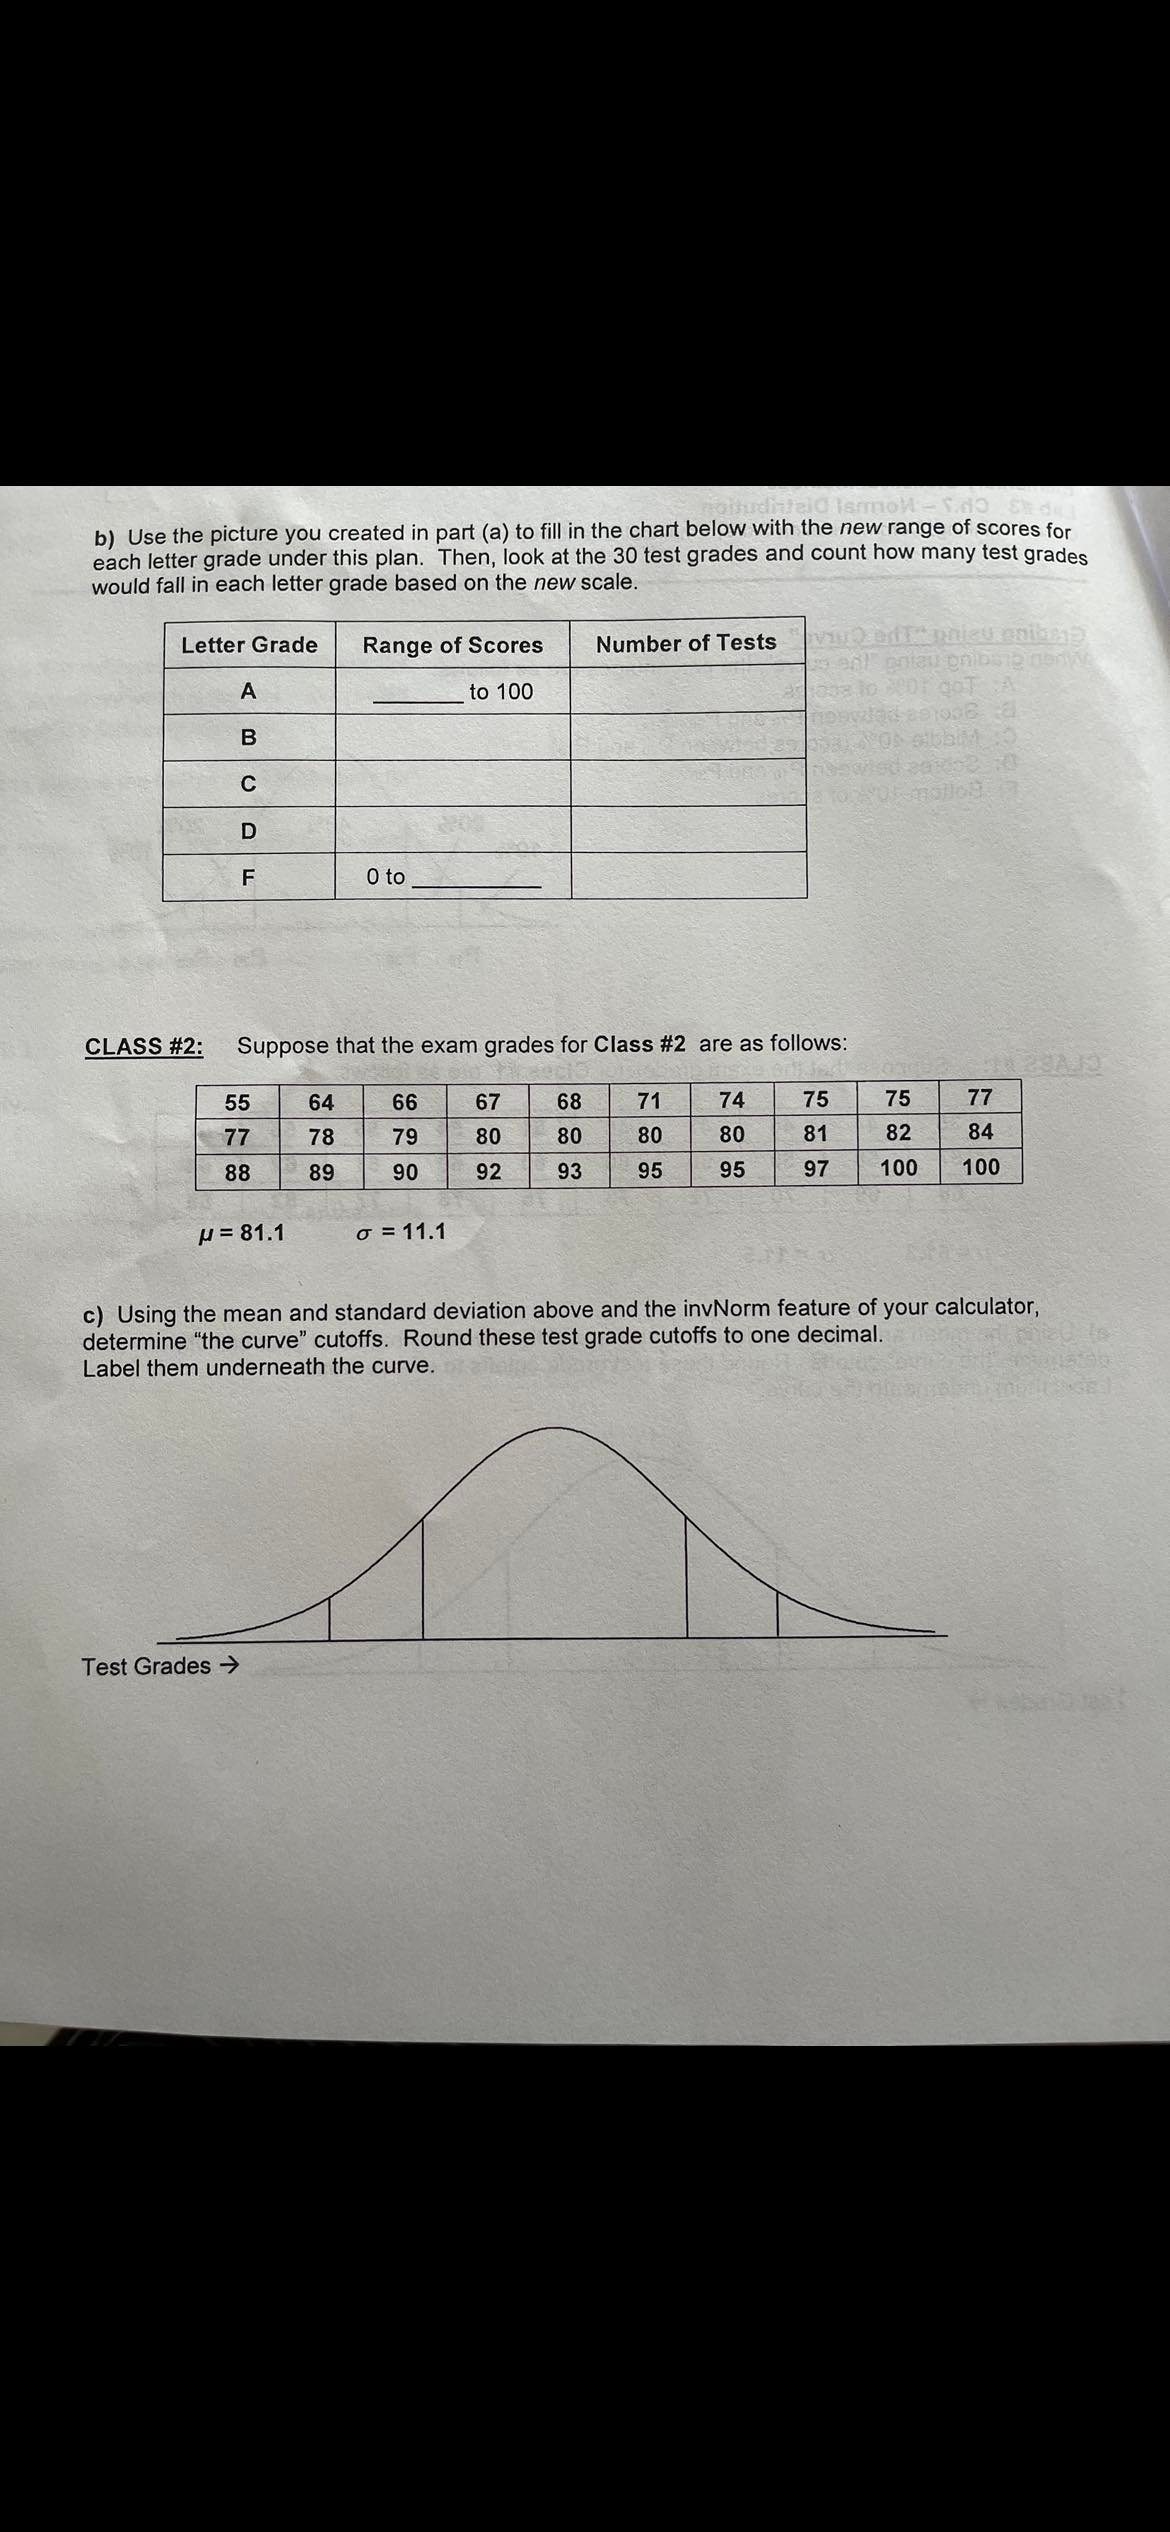
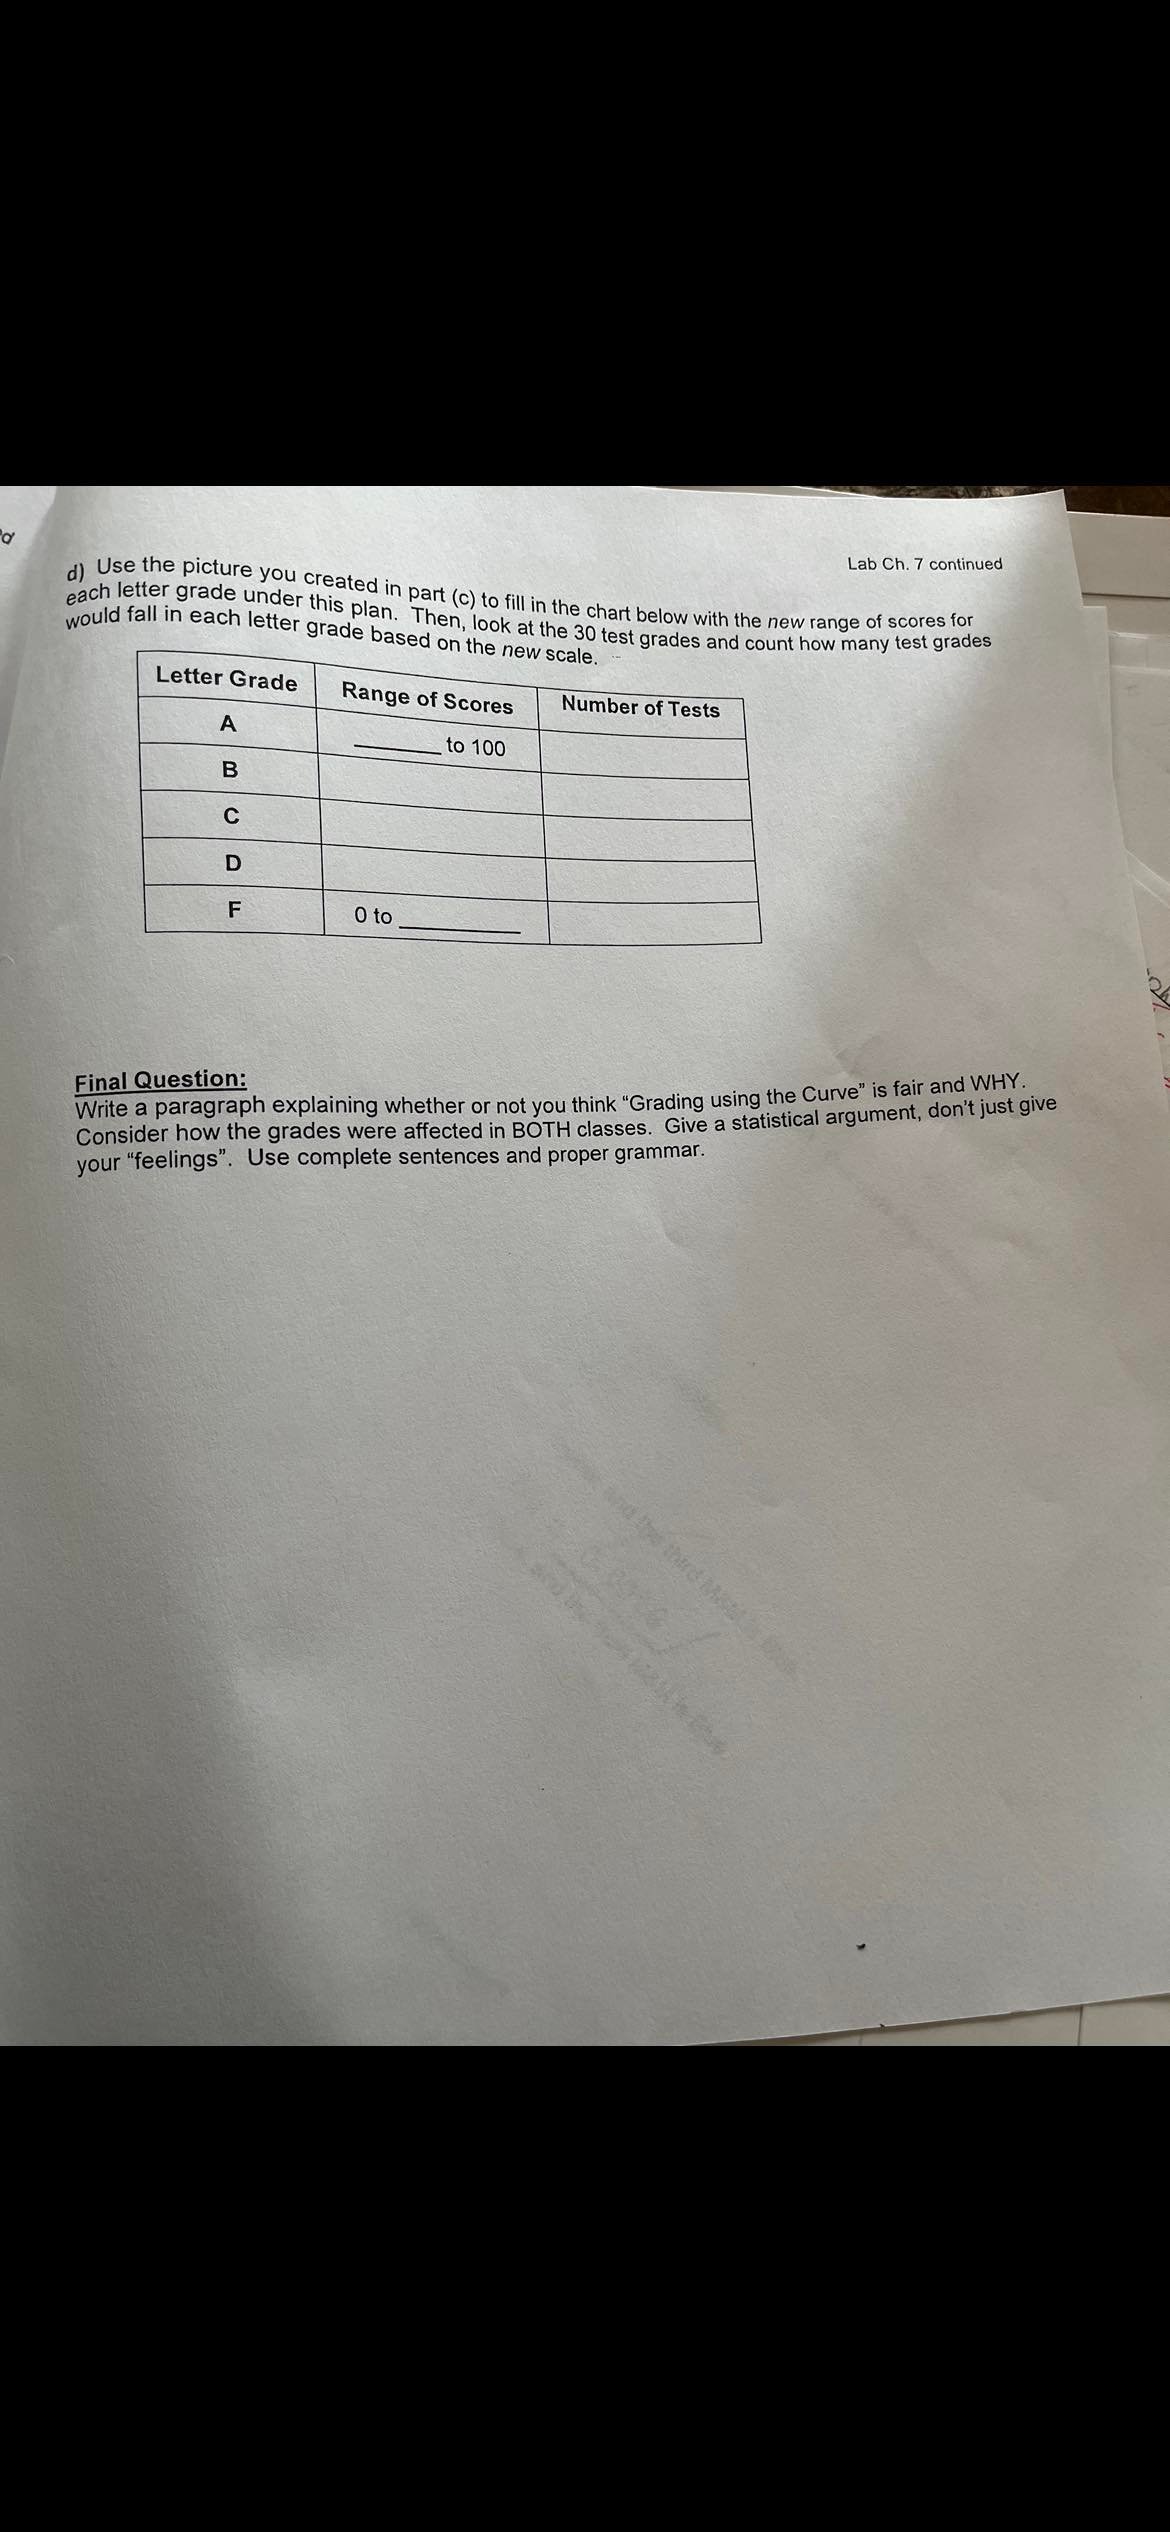
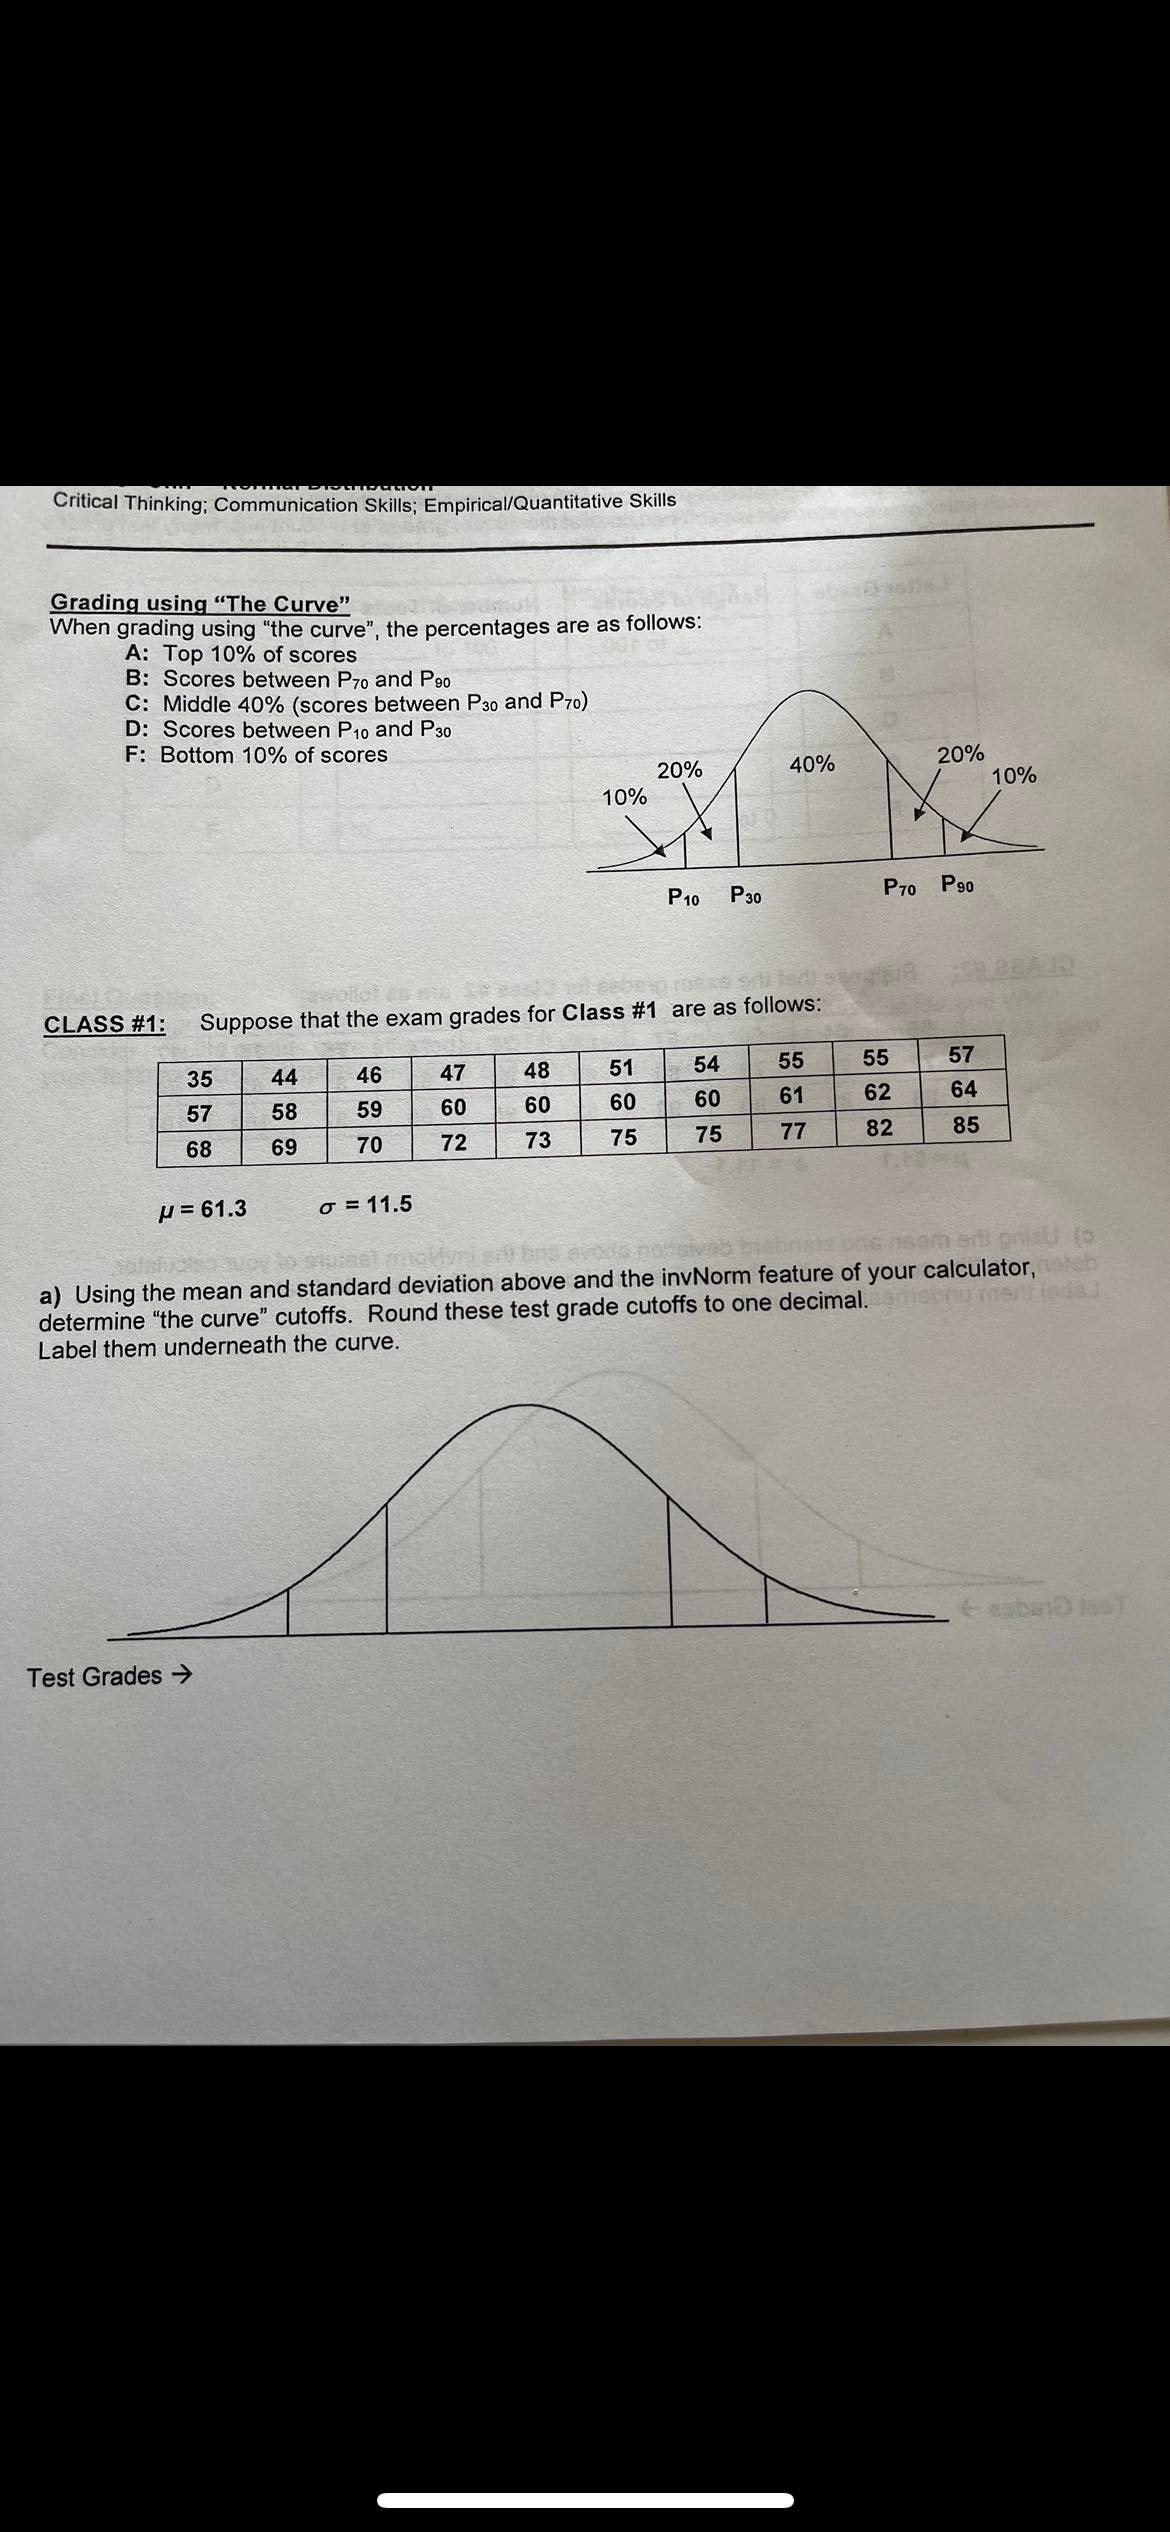
b) Use the picture you created in part (a) to fill in the chart below with the new range of scores for each letter grade under this plan. Then, look at the 30 test grades and count how many test grades would fall in each letter grade based on the new scale. Letter Grade A Range of Scores to 100 Number of Tests B C D F O to us enl potau on bio non e box to 3001 goT A sbb : 05 mollo9.9 CLASS #2: Suppose that the exam grades for Class #2 are as follows: 23AJ9 55 64 66 67 68 71 74 75 75 77 78 79 80 80 80 81 88 89 90 92 93 95 95 97 100 528 77 84 100 H = 81.1 = 11.1 c) Using the mean and standard deviation above and the invNorm feature of your calculator, determine "the curve" cutoffs. Round these test grade cutoffs to one decimal. Label them underneath the curve. Test Grades d Lab Ch. 7 continued d) Use the picture you created in part (c) to fill in the chart below with the new range of scores for each letter grade under this plan. Then, look at the 30 test grades and count how many test grades would fall in each letter grade based on the new scale. Letter Grade Range of Scores Number of Tests A to 100 B C D F O to Final Question: Write a paragraph explaining whether or not you think "Grading using the Curve" is fair and WHY. Consider how the grades were affected in BOTH classes. Give a statistical argument, don't just give your "feelings". Use complete sentences and proper grammar. and the third Mis Critical Thinking; Communication Skills; Empirical/Quantitative Skills Grading using "The Curve" When grading using "the curve", the percentages are as follows: A: Top 10% of scores B: Scores between P70 and P90 C: Middle 40% (scores between P30 and P70) D: Scores between P10 and P30 F: Bottom 10% of scores 20% 40% 20% 10% 10% P10 P30 P70 P90 CLASS #1: Suppose that the exam grades for Class #1 are as follows: 35 44 46 47 48 51 54 55 55 57 57 58 59 60 60 60 68 69 70 72 73 75 675 60 61 62 64 77 82 85 = 61.3 = 11.5 avods no sivab bichnetz bag som er gnial (> a) Using the mean and standard deviation above and the invNorm feature of your calculator, determine "the curve" cutoffs. Round these test grade cutoffs to one decimal. Label them underneath the curve. Test Grades ->
Step by Step Solution
There are 3 Steps involved in it
Step: 1

Get Instant Access to Expert-Tailored Solutions
See step-by-step solutions with expert insights and AI powered tools for academic success
Step: 2

Step: 3
Ace Your Homework with AI
Get the answers you need in no time with our AI-driven, step-by-step assistance
Get Started
Complex Variables and Applications
Authors: James Brown, Ruel Churchill
8th edition
73051942, 978-0073051949