

Question
B. Use the rule of 2 to generate a frequency table for salary, attendance, and wins. makea relative frequency table and a pie graph for
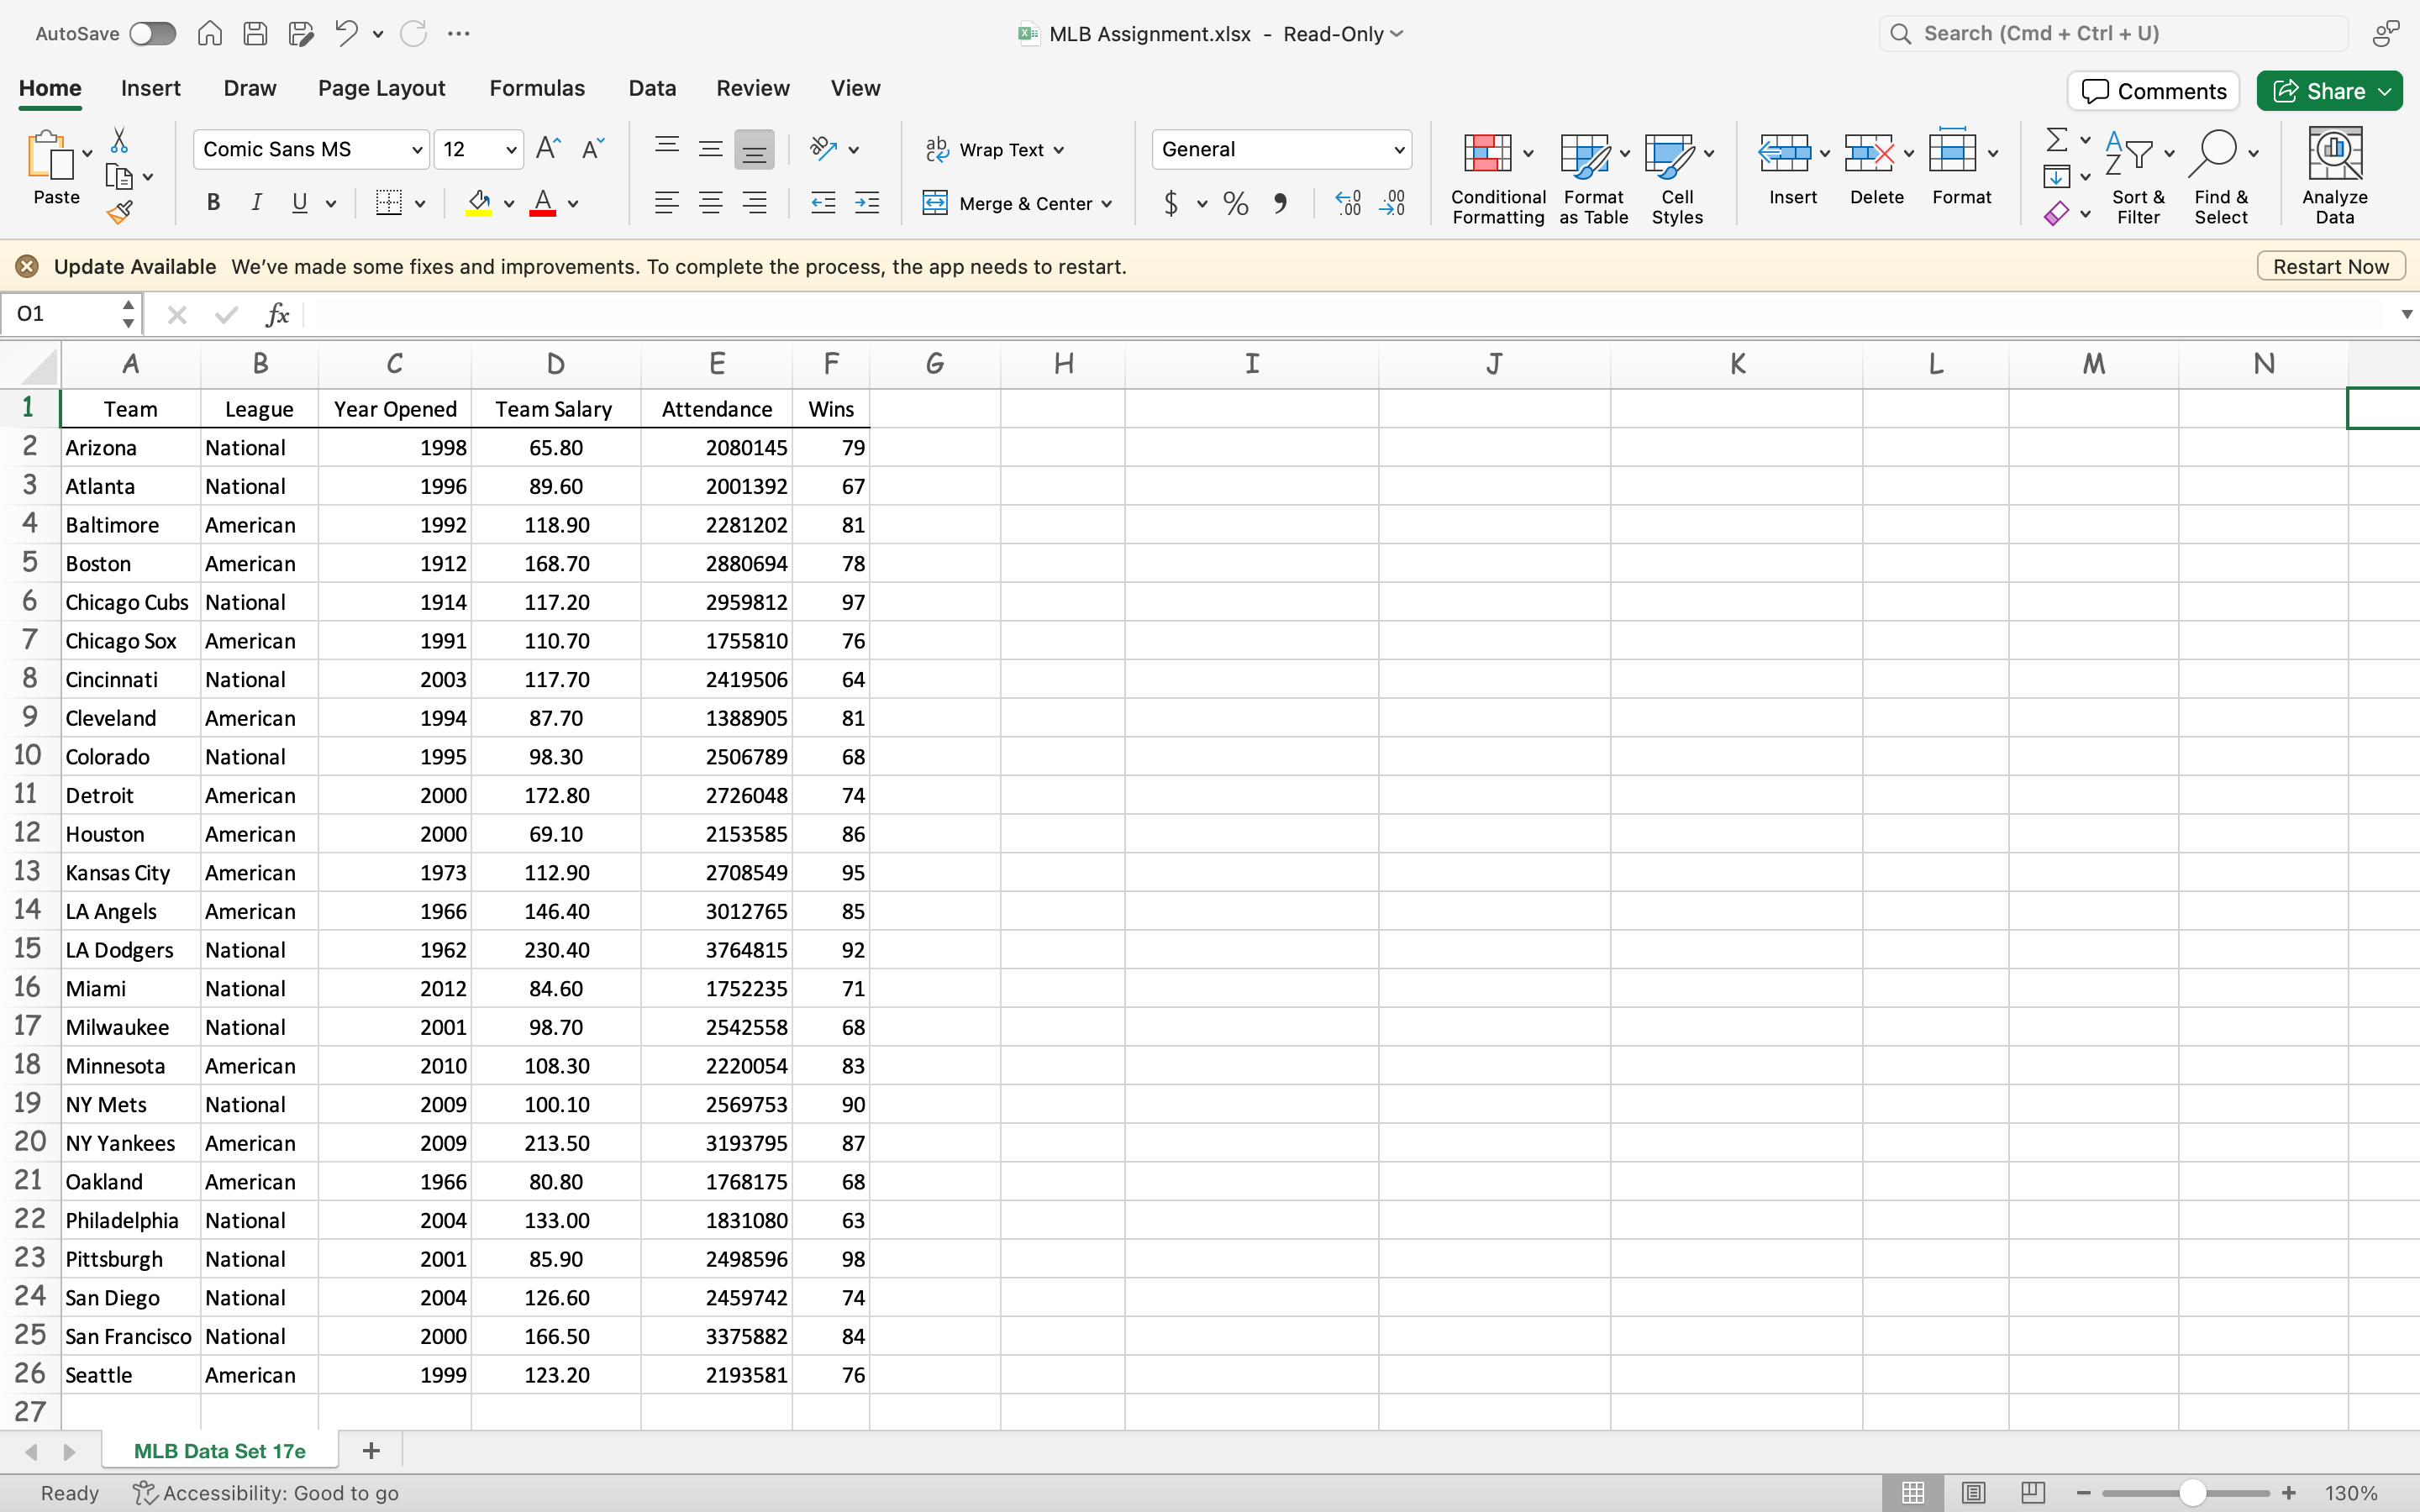
B. Use the rule of 2 to generate a frequency table for salary, attendance, and wins. makea relative frequency table and a pie graph for those variables as well. Which class has the largest frequency? Which class has the smallest frequency?
C. makea scatter plot between salary and attendance as well as salary and wins. Is there a direct or indirect relationship between salary and attendance? What about the relationship between salary and the number of wins? What are the correlation coefficients?
D. Calculate the standard error for salary. Then, calculate a confidence interval around the mean associated with an alpha of 0.05, 0.10 and 0.32. Explain in each case how confident you are that the mean falls in that interval.
E. Conclude with a short write up using the scientific method. You will want to determine the critical values for a two tailed hypothesis test for the 95%, 90% and 68% levels of confidence for salary, attendance, and wins.
Step by Step Solution
There are 3 Steps involved in it
Step: 1

Get Instant Access to Expert-Tailored Solutions
See step-by-step solutions with expert insights and AI powered tools for academic success
Step: 2

Step: 3
Ace Your Homework with AI
Get the answers you need in no time with our AI-driven, step-by-step assistance
Get Started
Finite Mathematics and Its Applications
Authors: Larry J. Goldstein, David I. Schneider, Martha J. Siegel, Steven Hair
12th edition
ISBN: 978-0134768588, 9780134437767, 134768582, 134437764, 978-0134768632