

B-1. 14 marks]: Identify and list all variables from Table 1, make a list of them,...
Fantastic news! We've Found the answer you've been seeking!
Question:
![B-1. 14 marks]: Identify and list all variables from Table 1, make a list of them, and print them on the](https://dsd5zvtm8ll6.cloudfront.net/si.experts.images/questions/2023/10/651a513a4562a_1696223544845.jpg)
Transcribed Image Text:
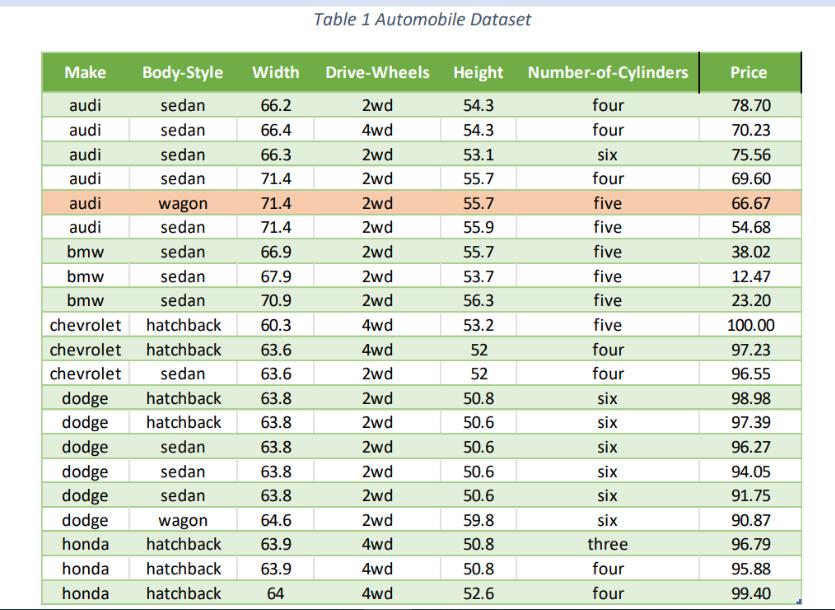
B-1. 14 marks]: Identify and list all variables from Table 1, make a list of them, and print them on the output cell. What does Figure I's data represent? B-2. 15 marks]: Classify the variables in Table 1 into field types, make a list to hold the identified field types, use the zip() function to zip the field name with its type, and then print the zipped data in a table format with the headers Field Name and Field Type. B-3. [3 marks]: Study Table 1, and determine for each variable its type as either independent or dependent. Then, use a list to store the type per each variable and print them as a table Field Name Field Type Independent Var. Note the values of the Independent Var field should be either Yes or No B-4. [3 marks]: Using the data in Table 1, plot a histogram of the Body-Style field. Configure the plot with the label "Cars Body-Style" on the horizontal axis and "Frequency" on the vertical axis. Finally, use "Body-Style Histogram" as a plot title. B-5. [6 marks]: Using Price field from Table 1, we want to generate and plot a histogram with 5 bins. First, compute the bin width and determine the bin range (start value and end value of each bin). Then, configure the plot with Car Prices Histogram as a title, Frequency as a y- axis label, and Cars Prices as an x-axis label. B-6. 15 marks]: Plot the pie chart for Number-of-Cylinders. Configure your pie plot to show data labels consisting of percentages (one decimal place) along with a count (shown in parentheses). For example, 33.3% (count - 7). B-7. 15 marks]: For each Audi and Dodge car, find and print the mean and median Price with three decimal places. B-8. [4 marks]: Convert the values in the Width field to integers and compute the field mode. B-9. 15 marks]: Identify the outliers in each numerical variable in Tabe 1, if any, print them, and use the appropriate approach to depict them visually. B-10. Given the scores of students in two homeworks (HWI and HW2) as listed below. HW1 = [45, 50, 55, 60, 55, 75, 70, 75, 70, 70, 75, 100, 60, 70, 60, 80, 81, 71, 50, 60, 75, 55, 70, 80, 100] HW2= [ 60, 80, 60, 70.5, 60.5, 70, 61, 72, 77, 60, 50, 65, 60, 60, 81, 79, 60, 70, 53, 40, 50, 100, 70, 60, 95] Make Body-Style Width sedan 66.2 sedan 66.4 sedan 66.3 sedan 71.4 audi audi audi audi 71.4 71.4 66.9 sedan 67.9 sedan 70.9 chevrolet hatchback 60.3 chevrolet hatchback 63.6 chevrolet sedan 63.6 dodge hatchback 63.8 dodge hatchback 63.8 dodge sedan 63.8 dodge sedan 63.8 dodge sedan 63.8 dodge wagon 64.6 honda hatchback 63.9 honda hatchback 63.9 honda hatchback 64 audi audi bmw bmw bmw wagon sedan sedan Table 1 Automobile Dataset Drive-Wheels Height Number-of-Cylinders 2wd 54.3 four 4wd 54.3 four 53.1 six 55.7 four 55.7 55.9 55.7 53.7 56.3 53.2 52 2wd 2wd 2wd 2wd 2wd 2wd 2wd 4wd 4wd 2wd 2wd 2wd 2wd 2wd 2wd 2wd 4wd 4wd 4wd 52 50.8 50.6 50.6 50.6 50.6 59.8 50.8 50.8 52.6 five five five five five five four four six six six six six six three four four Price 78.70 70.23 75.56 69.60 66.67 54.68 38.02 12.47 23.20 100.00 97.23 96.55 98.98 97.39 96.27 94.05 91.75 90.87 96.79 95.88 99.40 B-1. 14 marks]: Identify and list all variables from Table 1, make a list of them, and print them on the output cell. What does Figure I's data represent? B-2. 15 marks]: Classify the variables in Table 1 into field types, make a list to hold the identified field types, use the zip() function to zip the field name with its type, and then print the zipped data in a table format with the headers Field Name and Field Type. B-3. [3 marks]: Study Table 1, and determine for each variable its type as either independent or dependent. Then, use a list to store the type per each variable and print them as a table Field Name Field Type Independent Var. Note the values of the Independent Var field should be either Yes or No B-4. [3 marks]: Using the data in Table 1, plot a histogram of the Body-Style field. Configure the plot with the label "Cars Body-Style" on the horizontal axis and "Frequency" on the vertical axis. Finally, use "Body-Style Histogram" as a plot title. B-5. [6 marks]: Using Price field from Table 1, we want to generate and plot a histogram with 5 bins. First, compute the bin width and determine the bin range (start value and end value of each bin). Then, configure the plot with Car Prices Histogram as a title, Frequency as a y- axis label, and Cars Prices as an x-axis label. B-6. 15 marks]: Plot the pie chart for Number-of-Cylinders. Configure your pie plot to show data labels consisting of percentages (one decimal place) along with a count (shown in parentheses). For example, 33.3% (count - 7). B-7. 15 marks]: For each Audi and Dodge car, find and print the mean and median Price with three decimal places. B-8. [4 marks]: Convert the values in the Width field to integers and compute the field mode. B-9. 15 marks]: Identify the outliers in each numerical variable in Tabe 1, if any, print them, and use the appropriate approach to depict them visually. B-10. Given the scores of students in two homeworks (HWI and HW2) as listed below. HW1 = [45, 50, 55, 60, 55, 75, 70, 75, 70, 70, 75, 100, 60, 70, 60, 80, 81, 71, 50, 60, 75, 55, 70, 80, 100] HW2= [ 60, 80, 60, 70.5, 60.5, 70, 61, 72, 77, 60, 50, 65, 60, 60, 81, 79, 60, 70, 53, 40, 50, 100, 70, 60, 95] Make Body-Style Width sedan 66.2 sedan 66.4 sedan 66.3 sedan 71.4 audi audi audi audi 71.4 71.4 66.9 sedan 67.9 sedan 70.9 chevrolet hatchback 60.3 chevrolet hatchback 63.6 chevrolet sedan 63.6 dodge hatchback 63.8 dodge hatchback 63.8 dodge sedan 63.8 dodge sedan 63.8 dodge sedan 63.8 dodge wagon 64.6 honda hatchback 63.9 honda hatchback 63.9 honda hatchback 64 audi audi bmw bmw bmw wagon sedan sedan Table 1 Automobile Dataset Drive-Wheels Height Number-of-Cylinders 2wd 54.3 four 4wd 54.3 four 53.1 six 55.7 four 55.7 55.9 55.7 53.7 56.3 53.2 52 2wd 2wd 2wd 2wd 2wd 2wd 2wd 4wd 4wd 2wd 2wd 2wd 2wd 2wd 2wd 2wd 4wd 4wd 4wd 52 50.8 50.6 50.6 50.6 50.6 59.8 50.8 50.8 52.6 five five five five five five four four six six six six six six three four four Price 78.70 70.23 75.56 69.60 66.67 54.68 38.02 12.47 23.20 100.00 97.23 96.55 98.98 97.39 96.27 94.05 91.75 90.87 96.79 95.88 99.40
Expert Answer:
Answer rating: 100% (QA)
Solutions Step 1 B1 Identity and list all variables from Table 1 Make a list of them and print them Variables in Table 1 Make Body style Width Drive wheels Height Number of Cylinders Price What does F... View the full answer

Related Book For 

Income Tax Fundamentals 2013
ISBN: 9781285586618
31st Edition
Authors: Gerald E. Whittenburg, Martha Altus Buller, Steven L Gill
Posted Date:
Students also viewed these programming questions
-
Write a script to determine whether a given file system or mount point is mounted, and output the amount of free space on the file system if it is mounted. If the file system is not mounted, the...
-
Planning is one of the most important management functions in any business. A front office managers first step in planning should involve determine the departments goals. Planning also includes...
-
The following additional information is available for the Dr. Ivan and Irene Incisor family from Chapters 1-5. Ivan's grandfather died and left a portfolio of municipal bonds. In 2012, they pay Ivan...
-
Host A has a file of 49.5Kbytes to send to host C and host B has a file of 70.5Kbytes to send to host D, both using TCP. TCP connection 1 from A to C and TCP connection 2 from B to D share one...
-
Suppose you are driving a car in a counterclockwise direction on a circular road whose radius is r = 390 m (see the figure). You look at the speedometer and it reads a steady 32 m/s (about 72 mi/h)....
-
Jason and Mary Wells, friends of yours, were married on December 30, 2014. They know you are studying taxes and have come to you with a question concerning their filing status. Jason and Mary would...
-
Journal entries} {Required:} Using the data in P5-7: 1. The cost of goods received from Shaping during the month. 2. The production costs incurred in Forming during the month. 3. The cost of goods...
-
The following selected transactions were completed by Capers Company during October of the current year: Oct. 1. Purchased merchandise from UK Imports Co., $14,448, terms FOB destination, n/30. 3....
-
A borrower has a 30-year mortgage loan for $2,000,000with an annual interest rate of 4.25% and monthly payments. If she wants to pay off the loan after 8 years, what would be the outstanding balance...
-
Solve this in python. **[70 pts]** You will be writing code for recording the menuitems and daily sales of a lemonade stand. It will have theseclasses: MenuItem, SalesForDay, and LemonadeStand. All...
-
In a cooling system, a 24mm diameter shaft is used to connect a fan at D to a pulley at C and supported by a thrust bearing at A and ball bearing at B. The pulley C (diameter 800mm) weighing 35kg...
-
List and discuss four characteristics of an effective sales presentation or demonstration.
-
How should auditors use prior-year audit documentation in performing the con- trol risk assessment for the current year? What are the advantages and disadvan- tages of using prior-year documentation...
-
Assume an auditor concludes that there are material deficiencies in an organiza- tion's internal controls over financial reporting. Management agrees and reports the weaknesses in its report to...
-
Does the auditor's report on internal control cover all internal controls or only those over financial reporting? Explain the difference.
-
The auditor concludes that a public company has significant deficiencies in its in- ternal controls over financial reporting. Which of the following is a proper re- sponse to this finding? a. Report...
-
sider the function y 2. x+3 The vertical asymptote of the graph is The horizontal asymptote of the graph is The domain is all real numbers except The range is all real numbers except QUESTION 4 Which...
-
(a) Explain why the concentration of dissolved oxygen in freshwater is an important indicator of the quality of the water. (b) How is the solubility of oxygen in water affected by increasing...
-
Skyler is covered by his company's health insurance plan. The health insurance costs his company $3,500 a year. During the year, Skyler is diagnosed with a serious illness and the health insurance...
-
Steve Drake sells a rental house on January 1, 2012, and receives $130,000 cash and a note for $55,000 at 10 percent interest. The purchaser also assumes the mortgage on the property of $45,000....
-
In 2012, Margaret and John Murphy are married taxpayers who file a joint tax return with AGl of $25,000. During the year they incurred the following expenses: Hospitalization insurance...
-
Develop brief answers to each of the following questions: 1. How does a lender assess the risk that a borrower may defaultthat is, not pay interest and principal when due? 2. If a company with a high...
-
What should Cliff do? IHD was an international hospital company with hospitals in three different Central and South American countries. Cliff, IHDs chief operating officer, had worked for the...
-
Develop brief answers to each of the following questions: 1. What determines whether bonds are issued at a discount, premium, or face value? 2. Why does the market price of a bond vary over time? 3....

Study smarter with the SolutionInn App