Answered step by step
Verified Expert Solution
Question
1 Approved Answer
Back in 1970s, much of the gasoline used in cars contains lead rather than the unlead version found nowadays. A study measured the lead


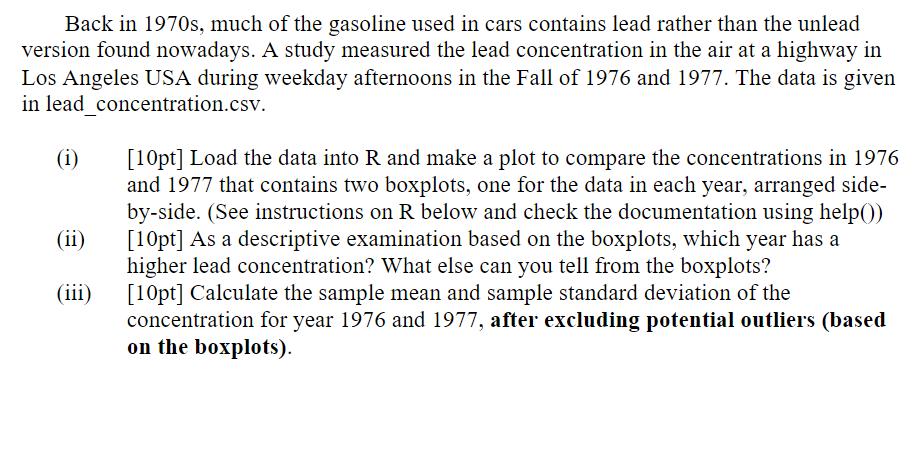
Back in 1970s, much of the gasoline used in cars contains lead rather than the unlead version found nowadays. A study measured the lead concentration in the air at a highway in Los Angeles USA during weekday afternoons in the Fall of 1976 and 1977. The data is given in lead_concentration.csv. (i) (ii) (iii) [10pt] Load the data into R and make a plot to compare the concentrations in 1976 and 1977 that contains two boxplots, one for the data in each year, arranged side- by-side. (See instructions on R below and check the documentation using help()) [10pt] As a descriptive examination based on the boxplots, which year has a higher lead concentration? What else can you tell from the boxplots? [10pt] Calculate the sample mean and sample standard deviation of the concentration for year 1976 and 1977, after excluding potential outliers (based on the boxplots). Fall 1976 Fall 1977 2.1 3.2 2.9 5 5.7 34 129ain 3.9 4.9 5.2 vi vi 5.4 249 5.9 5 5 10 10 10 10 10 10 10 10 10 10 10 6 6.1 6.1 010 01.0 9 6.2 9 9 6.3 6.4 77 6.4 50 00in AAAAWN 6.4 6.4 6.5 00 00 00 6.7 6.8 00 00 00 00 00 6.9 7.1 7.2 7.6 7.9 7 66 8.1 8.1 113 8.3 8.4 45567 8.5 8.5 8.6 8.7 9 9.2 9.3 9.7 10.9 11.2 10 10 10 10 10 6.3 6.5 un 000 6.6 6.8 7.3 3N 00 00 00 00 00 00 co a ai oi oi ai ai a an ano ano ano OOO 8.1 8.2 N 8.2 32 10 8.3 8.6 8.7 8.9 9.1 9.1 wi 9.3 9.3 9.4 9.4 9.4 9.4 9.5 9.8 9.8 9.9 9.9 10.2 10.3 10.5 10.5 10.7 11.4 12 12.4 14.8 16.7
Step by Step Solution
★★★★★
3.44 Rating (151 Votes )
There are 3 Steps involved in it
Step: 1
Here is the ...
Get Instant Access to Expert-Tailored Solutions
See step-by-step solutions with expert insights and AI powered tools for academic success
Step: 2

Step: 3

Ace Your Homework with AI
Get the answers you need in no time with our AI-driven, step-by-step assistance
Get Started


