Answered step by step
Verified Expert Solution
Link Copied!

Question

1 Approved Answer

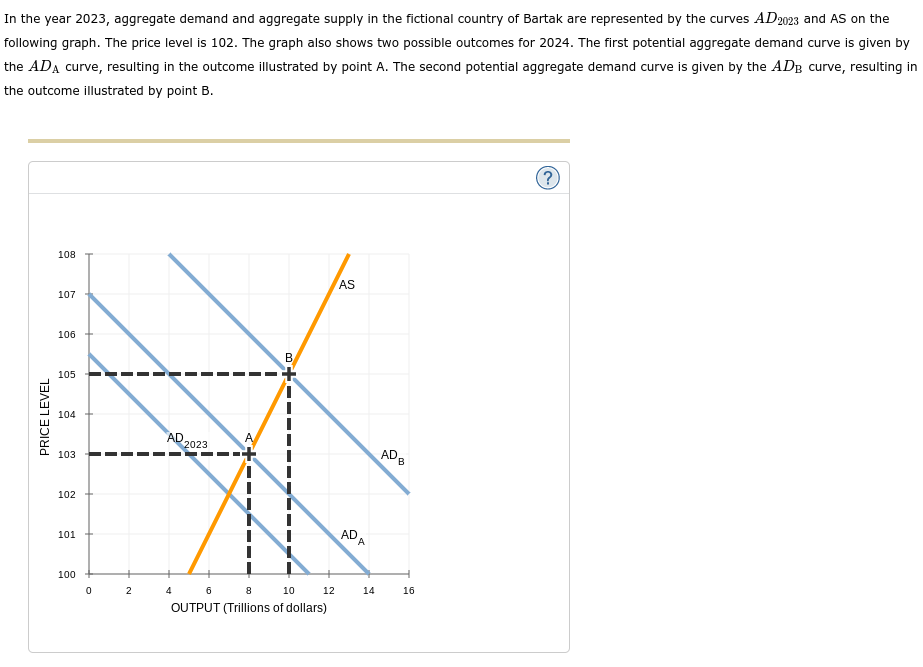
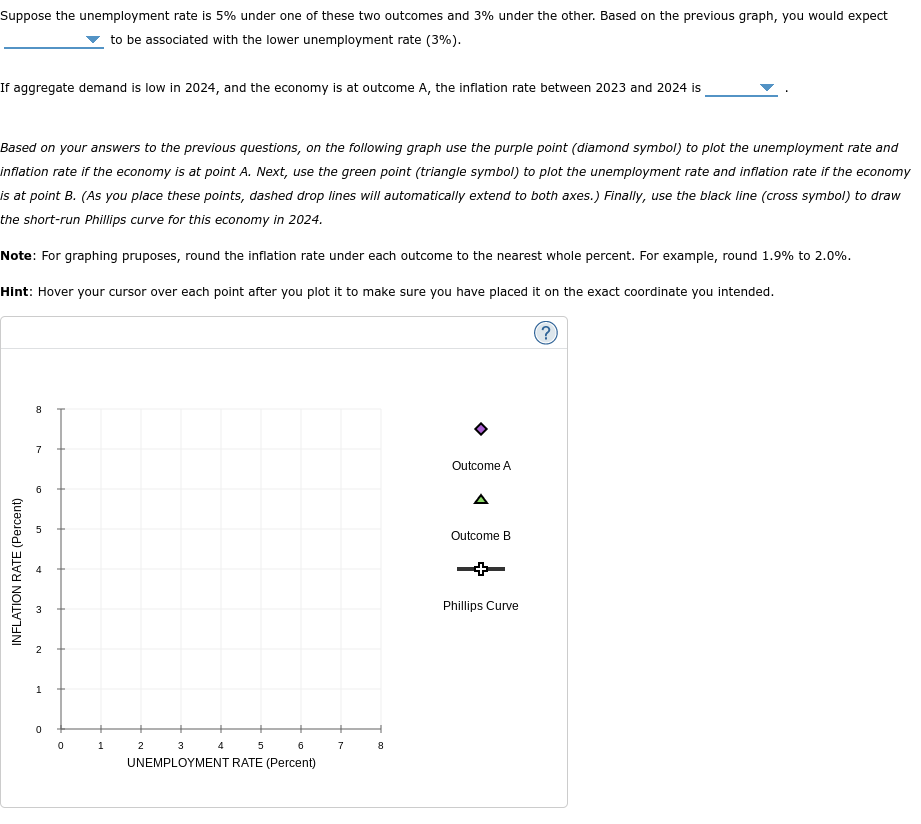
Background info: In the year 2023, aggregate demand and aggregate supply in the fictional country of Bartak are represented by the curves AD2023 and AS

Background info:

image text in transcribedimage text in transcribedimage text in transcribed
In the year 2023, aggregate demand and aggregate supply in the fictional country of Bartak are represented by the curves AD2023 and AS on the following graph. The price level is 102. The graph also shows two possible outcomes for 2024. The first potential aggregate demand curve is given by the ADA curve, resulting in the outcome illustrated by point A. The second potential aggregate demand curve is given by the ADg curve, resulting in the outcome illustrated by point B. ? 108 AS 107 106 B 105 104 PRICE LEVEL AL 2023 A 103 ADB 102 101 ADA 100 12 14 16 2 4 6 B 10 OUTPUT (Trillions of dollars)Suppose the unemployment rate is 5% under one of these two outcomes and 3% under the other. Based on the previous graph, you would expect to be associated with the lower unemployment rate (3%). If aggregate demand is low in 2024, and the economy is at outcome A, the inflation rate between 2023 and 2024 is Based on your answers to the previous questions, on the following graph use the purple point (diamond symbol) to plot the unemployment rate and inflation rate if the economy is at point A. Next, use the green point (triangle symbol) to plot the unemployment rate and inflation rate if the economy s at point B. (As you place these points, dashed drop lines will automatically extend to both axes. ) Finally, use the black line (cross symbol) to draw the short-run Phillips curve for this economy in 2024. Note: For graphing pruposes, round the inflation rate under each outcome to the nearest whole percent. For example, round 1.9% to 2.0%. Hint: Hover your cursor over each point after you plot it to make sure you have placed it on the exact coordinate you intended. B Outcome A 6 A Outcome B INFLATION RATE (Percent) 3 Phillips Curve 2 UNEMPLOYMENT RATE (Percent)Suppose that the government is considering enacting an expansionary policy in 2023 that would shift aggregate demand in 2024 from ADA to ADB. This would cause a the short-run Phillips curve, resulting in in the inflation rate and in the unemployment rate

Step by Step Solution

There are 3 Steps involved in it

Step: 1

blur-text-image

Get Instant Access to Expert-Tailored Solutions

See step-by-step solutions with expert insights and AI powered tools for academic success

Step: 2

blur-text-image

Step: 3

blur-text-image

Ace Your Homework with AI

Get the answers you need in no time with our AI-driven, step-by-step assistance

Get Started

Recommended Textbook for

Society, Economy, Religion And Festivals Of Tiwas In Assam

Authors: Bandana Baruah

1st Edition

9351288633, 9789351288633

More Books

Students also viewed these Economics questions

Question

Identify ways to increase your selfesteem.

Answered: 1 week ago