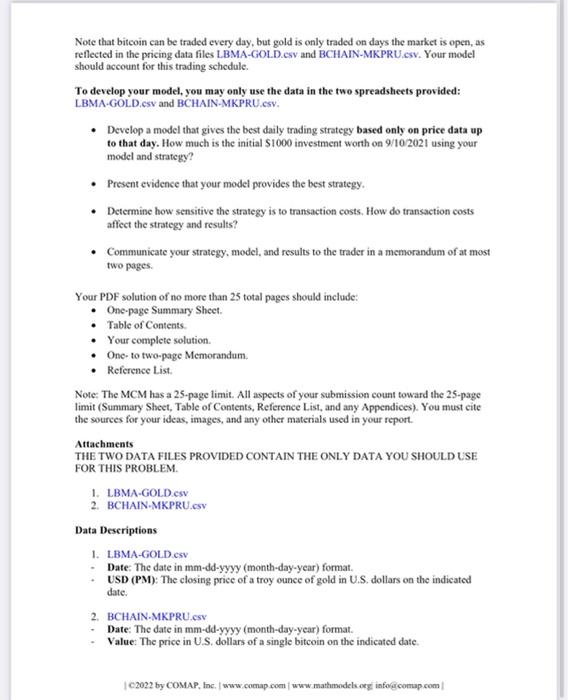
Background Market traders buy and sell volatile assets frequently, with a goal to maximize their total return. There is usually a commission for each purchase and sale. Two such assets are gold and bitcoin Figure 1: Gold daily prices, U.S. dollars per troy ounce. Source: London Bullion Market Association, 9/11/2021 Figure 2: Bitcoin daily prices, U.S. dollars per bitcoin. Source: NASDAQ, 9/11/2021 Requirement You have been asked by a trader to develop a model that uses only the past stream of daily prices to date to determine each day if the trader should buy, hold, or sell their assets in their portfolio. You will start with $1000 on 9/11/2016. You will use the five-year trading period, from 9/11/2016 to 9/10/2021. On each trading day, the trader will have a portfolio consisting of cash, gold, and bitcoin [C, G, B) in U.S. dollars, troy ounces, and bitcoins, respectively. The initial state is [1000, 0, 0). The commission for each transaction (purchase or sale) costs a% of the amount traded. Assume agoid = 1% and Obitcoin = 2%. There is no cost to hold an asset. Note that bitcoin can be traded every day, but gold is only traded on days the market is open, as reflected in the pricing data files LBMA-GOLD.csv and BCHAIN-MKPRU.esy. Your model should account for this trading schedule. To develop your model, you may only use the data in the two spreadsheets provided: LBMA-GOLD.csv and BCHAIN-MKPRU.csv Develop a model that gives the best daily trading strategy based only on price data up to that day. How much is the initial S1000 investment worth on 9/10/2021 using your model and strategy? Present evidence that your model provides the best strategy. Determine how sensitive the strategy is to transaction costs. How do transaction costs affect the strategy and results? Communicate your strategy, model, and results to the trader in a memorandum of at most two pages Your PDF solution of no more than 25 total pages should include: One-page Summary Sheet Table of Contents Your complete solution One-to two-page Memorandum Reference List Note: The MCM has a 25-page limit. All aspects of your submission count toward the 25-page limit (Summary Sheet, Table of Contents, Reference List, and any Appendices). You must cite the sources for your ideas, images, and any other materials used in your report. Attachments THE TWO DATA FILES PROVIDED CONTAIN THE ONLY DATA YOU SHOULD USE FOR THIS PROBLEM 1. LBMA-GOLD.csv 2. BCHAIN.MKPRU.CSV Data Descriptions 1. LBMA-GOLD.csv Date: The date in mm-dd-yyyy (month-day-year) format. USD (PM): The closing price of a troy ounce of gold in U.S. dollars on the indicated date. 2. BCHAIN-MKPRU CSV Date: The date in mm-dd-yyyy (month-day-year) format. Value: The price in US dollars of a single bitcoin on the indicated date C2022 by COMAP, Inc. www.comap.com www.mathundels cegi infos.comap.com Background Market traders buy and sell volatile assets frequently, with a goal to maximize their total return. There is usually a commission for each purchase and sale. Two such assets are gold and bitcoin Figure 1: Gold daily prices, U.S. dollars per troy ounce. Source: London Bullion Market Association, 9/11/2021 Figure 2: Bitcoin daily prices, U.S. dollars per bitcoin. Source: NASDAQ, 9/11/2021 Requirement You have been asked by a trader to develop a model that uses only the past stream of daily prices to date to determine each day if the trader should buy, hold, or sell their assets in their portfolio. You will start with $1000 on 9/11/2016. You will use the five-year trading period, from 9/11/2016 to 9/10/2021. On each trading day, the trader will have a portfolio consisting of cash, gold, and bitcoin [C, G, B) in U.S. dollars, troy ounces, and bitcoins, respectively. The initial state is [1000, 0, 0). The commission for each transaction (purchase or sale) costs a% of the amount traded. Assume agoid = 1% and Obitcoin = 2%. There is no cost to hold an asset. Note that bitcoin can be traded every day, but gold is only traded on days the market is open, as reflected in the pricing data files LBMA-GOLD.csv and BCHAIN-MKPRU.esy. Your model should account for this trading schedule. To develop your model, you may only use the data in the two spreadsheets provided: LBMA-GOLD.csv and BCHAIN-MKPRU.csv Develop a model that gives the best daily trading strategy based only on price data up to that day. How much is the initial S1000 investment worth on 9/10/2021 using your model and strategy? Present evidence that your model provides the best strategy. Determine how sensitive the strategy is to transaction costs. How do transaction costs affect the strategy and results? Communicate your strategy, model, and results to the trader in a memorandum of at most two pages Your PDF solution of no more than 25 total pages should include: One-page Summary Sheet Table of Contents Your complete solution One-to two-page Memorandum Reference List Note: The MCM has a 25-page limit. All aspects of your submission count toward the 25-page limit (Summary Sheet, Table of Contents, Reference List, and any Appendices). You must cite the sources for your ideas, images, and any other materials used in your report. Attachments THE TWO DATA FILES PROVIDED CONTAIN THE ONLY DATA YOU SHOULD USE FOR THIS PROBLEM 1. LBMA-GOLD.csv 2. BCHAIN.MKPRU.CSV Data Descriptions 1. LBMA-GOLD.csv Date: The date in mm-dd-yyyy (month-day-year) format. USD (PM): The closing price of a troy ounce of gold in U.S. dollars on the indicated date. 2. BCHAIN-MKPRU CSV Date: The date in mm-dd-yyyy (month-day-year) format. Value: The price in US dollars of a single bitcoin on the indicated date C2022 by COMAP, Inc. www.comap.com www.mathundels cegi infos.comap.com