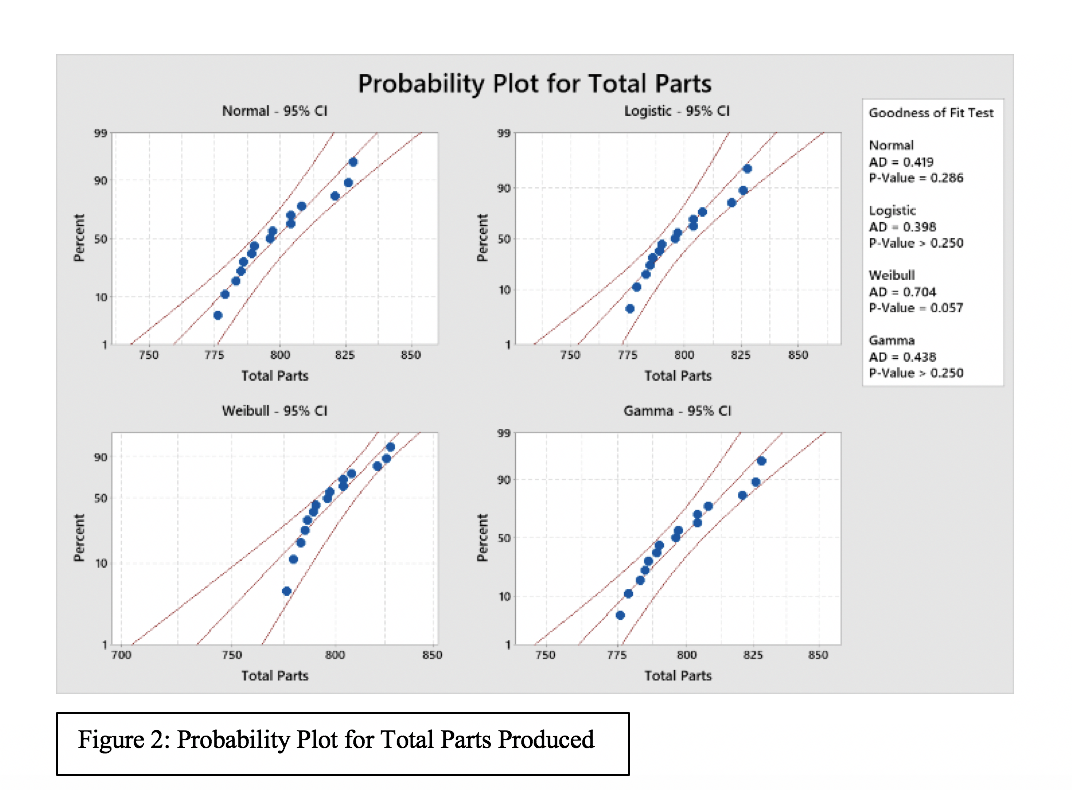
Background
The Mouse Factory has been operating without a quality manager for the past four months.You have been hired as the new quality manager and your responsibility is to improve the overall quality at The Mouse Factory.The company maintains an electronic database of production records and an electronic database of all quality related exceptions.You are to analyze this data, establish quality and production benchmarks and formulate a quality improvement plan.
Each part is inspected.Certain critical quality characteristics contain specification limits.If the measurement is outside of the specification limits the part is classified as bad and labeled as "Variable outside of specification" in the quality records.Parts are inspected to determine if they are conforming or non-conforming.Non-conforming parts are also counted as bad parts in the production records and labeled as "Part Nonconforming" in the quality records.Parts may contain nonconformities and not be classified as a bad part.Parts containing non-conformity are labeled "Nonconformity found" in the quality records and counted as an "off-spec part" in the production records
?Analyze the attached graphs and tables.
?Develop a quality improvement plan.Clearly state which area of The Mouse Factory that you would implement your first quality improvement project.
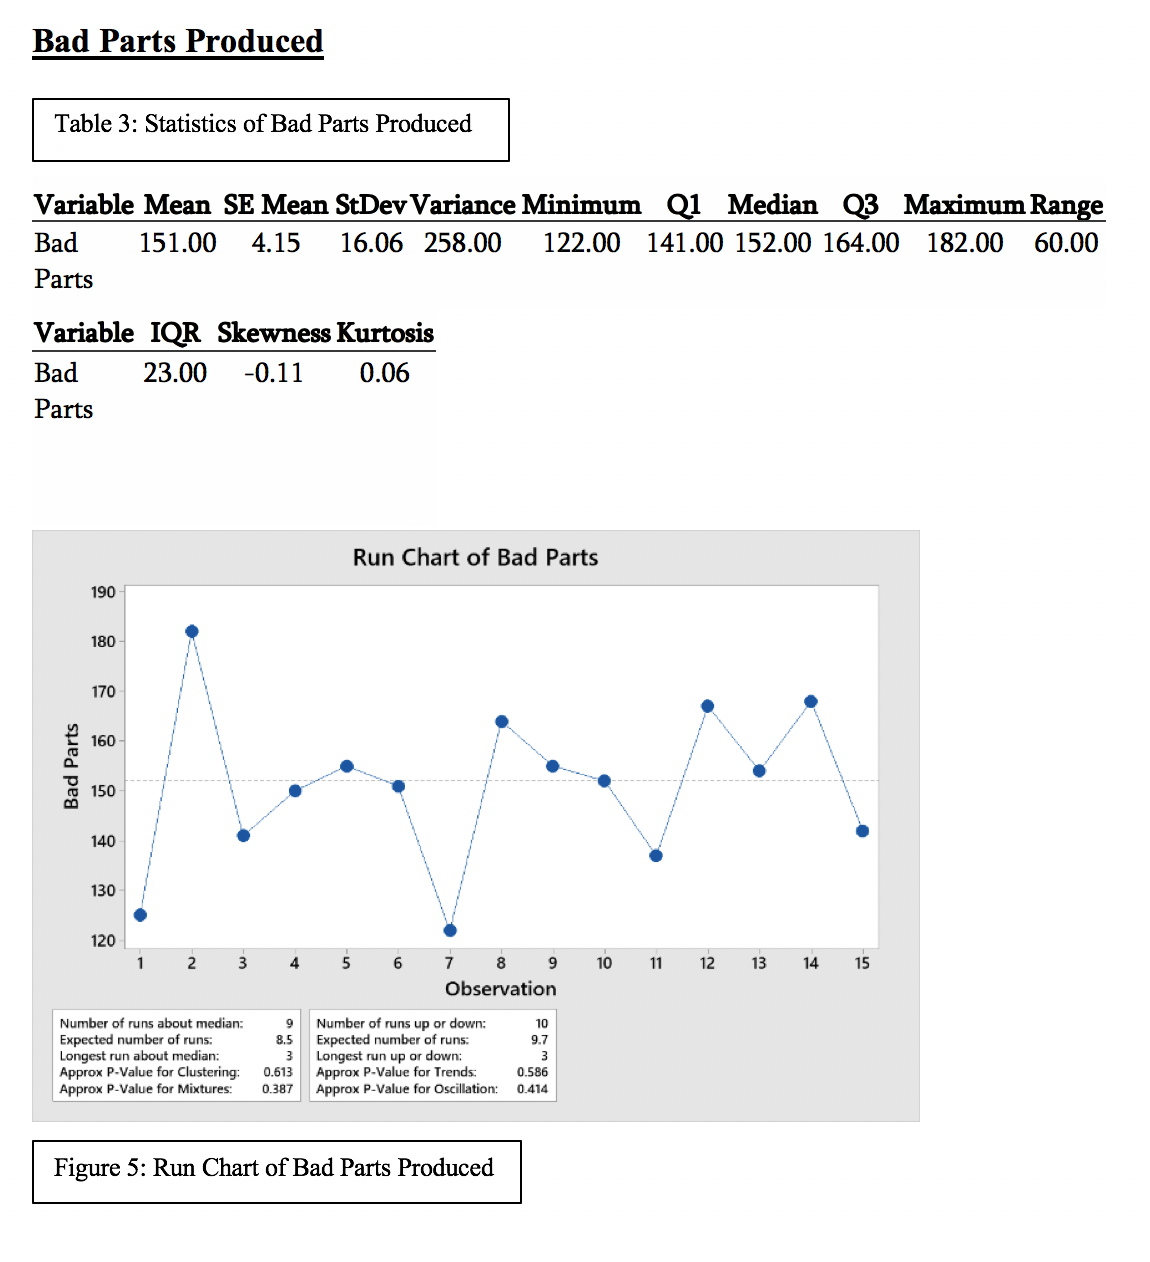
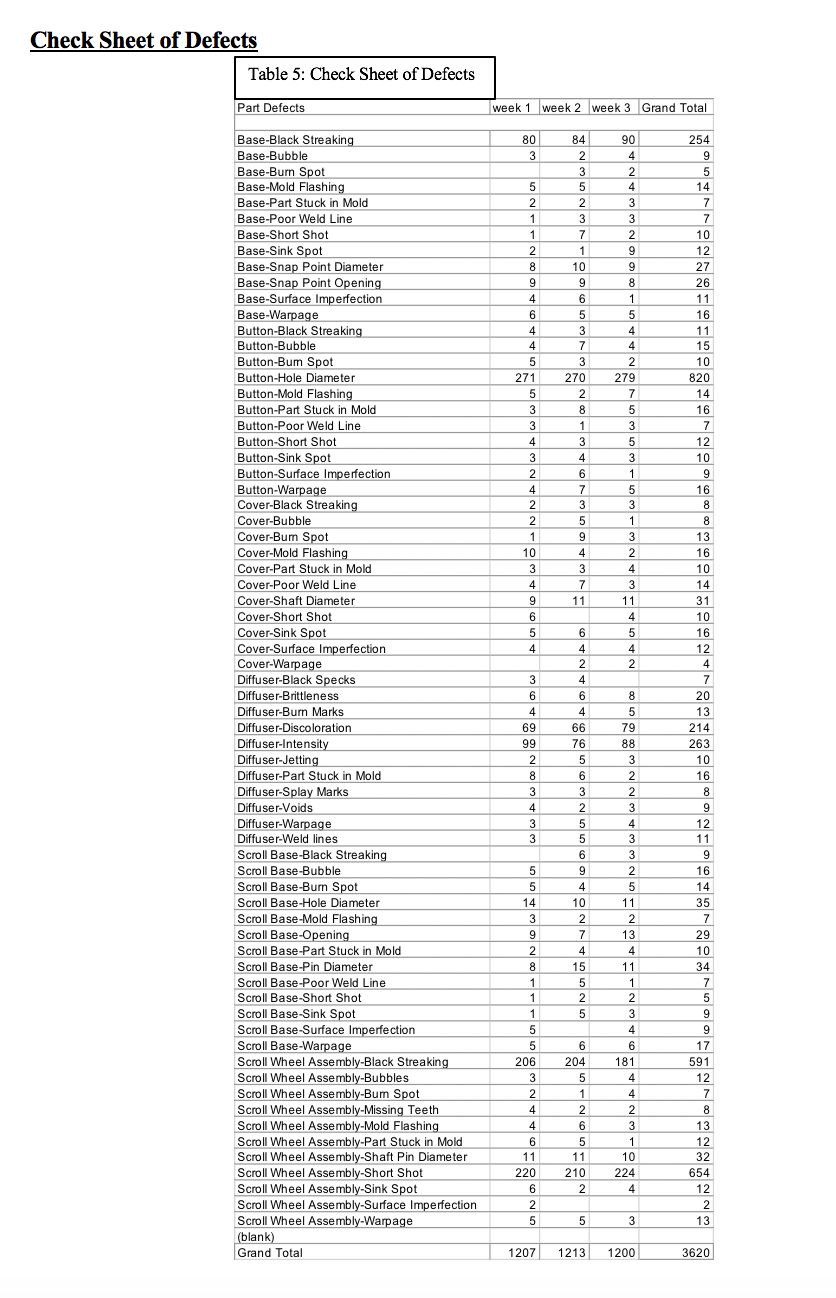
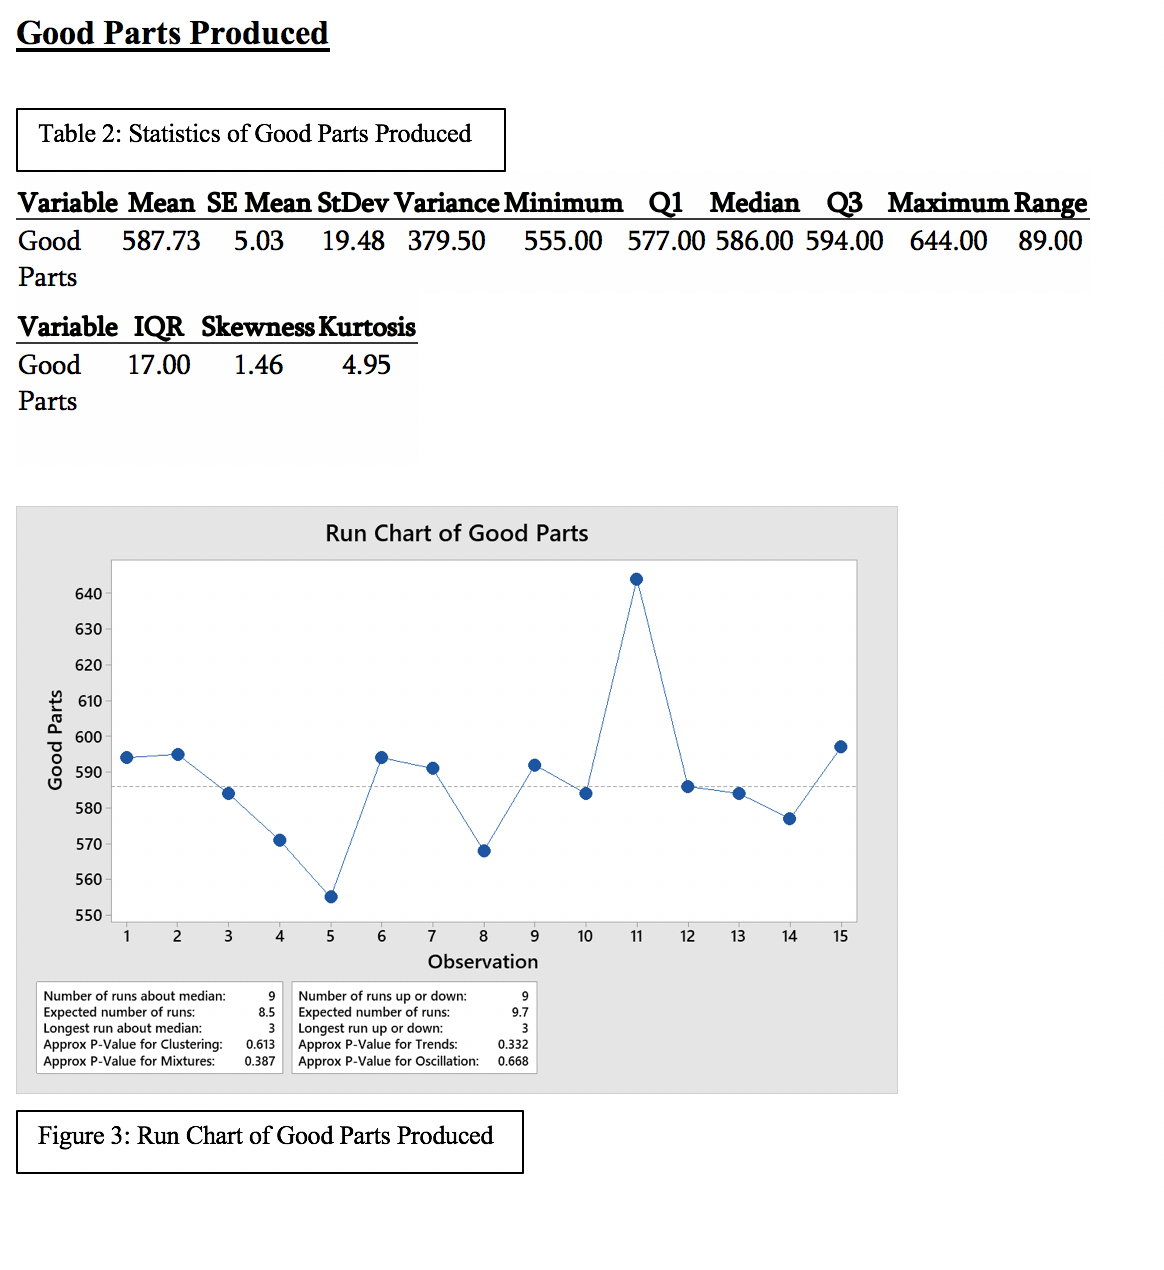
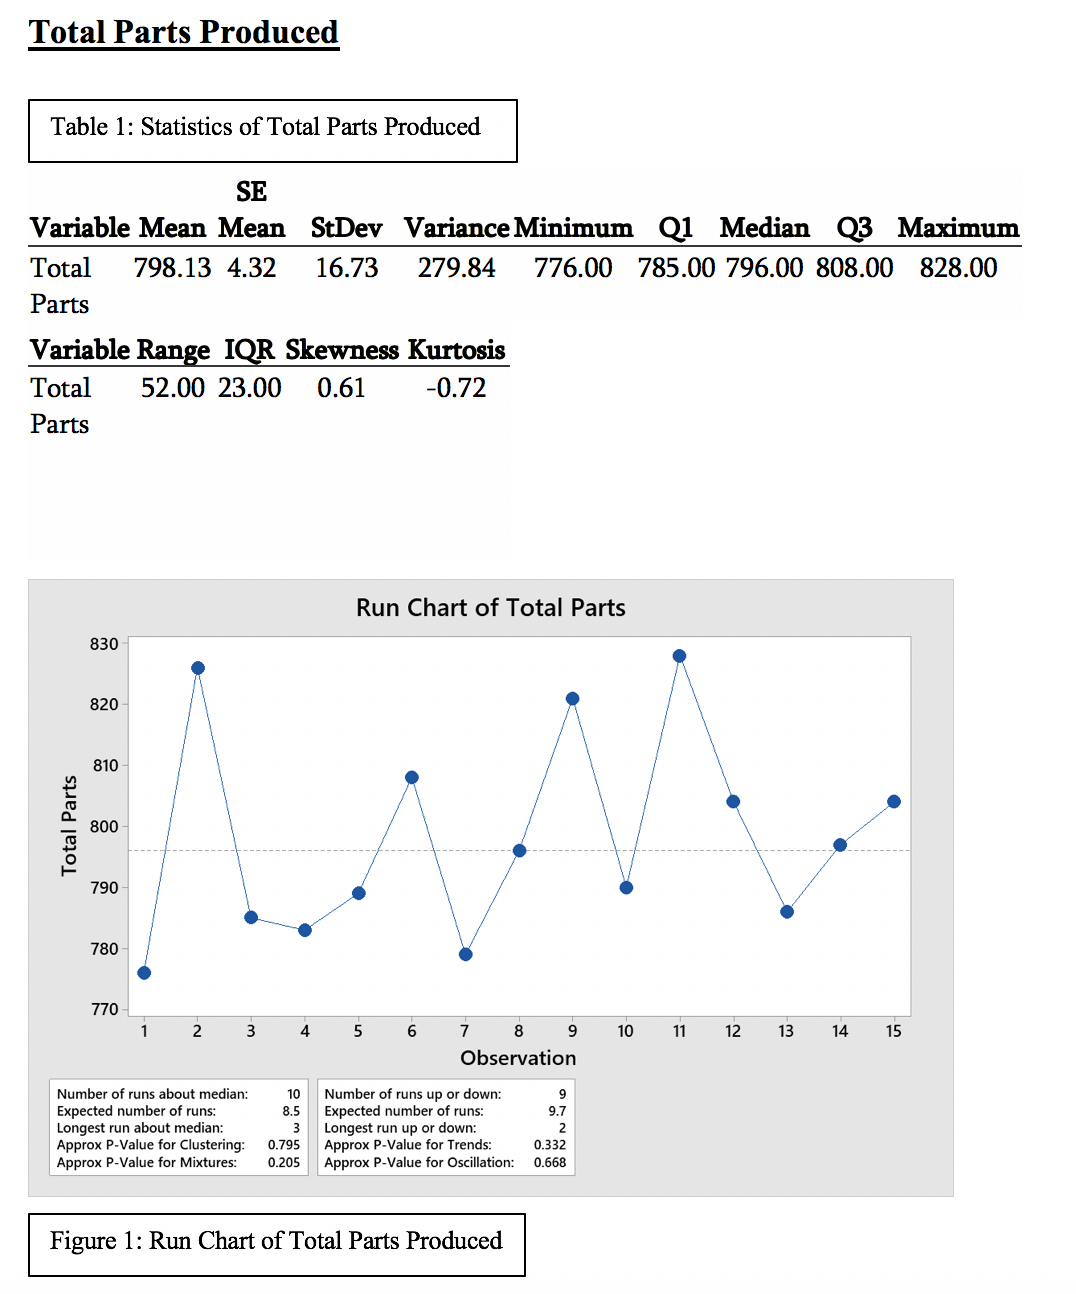
Bad Parts Produced Table 3: Statistics of Bad Parts Produced Variable Mean SE Mean StDev Variance Minimum Q1 Median Q3 Maximum Range Bad 151.00 4.15 16.06 258.00 122.00 141.00 152.00 164.00 182.00 60.00 Parts Variable IQR Skewness Kurtosis Bad 23.00 -0.11 0.06 Parts Run Chart of Bad Parts 190 180 170 Bad Parts 160 150 140 130 120 2 3 4 5 6 7 8 9 10 11 12 13 14 15 Observation Number of runs about median: Expected number of runs: 9 Number of runs up or down: 8.5 10 Expected number of runs: 17 Longest run about median: 3 Approx P-Value for Clustering: Longest run up or down: 0.613 Approx P-Value for Trends 0.586 Approx P-Value for Mixtures: 0.387 Approx P-Value for Oscillation: 0.414 Figure 5: Run Chart of Bad Parts Produced\fCheck Sheet of Defects Table 5: Check Sheet of Defects Part Defects week 1 week 2 week 3 Grand Total Base-Black Streaking 80 84 90 254 Base-Bubble 3 2 9 Base-Burn Spot 3 Base-Mold Flashing 5 14 Base-Part Stuck in Mold 2 Base-Poor Weld Line 7 Base-Short Shot 7 10 Base-Sink Spot 12 Base-Snap Point Diameter 10 27 Base-Snap Point Opening Base-Surface Imperfection Base-Warpage Button-Black Streaking itton-Bub Button-Bum Spot Button-Hole Diameter 27 Button-Mold Flashing Button-Part Stuck in Mold Button-Poor Weld Line Button-Short Shot Button-Sink Spot Button-Surface Imperfection Button-Warpage Cover-Black Streaking Cover-Bubble Cover-Bum Spot Cover-Mold Flashing Cover-Part Stuck in Mold Cover-Poor Weld Line Cover-Shaft Diameter Cover-Short Shot Cover-Sink Spot Cover-Surface Imperfection Cover-Warpage Diffuser-Black Specks Diffuser-Brittleness Diffuser-Burn Marks Diffuser-Discoloration Diffuser-Intensity DO A O W A DIO DO A W O - N N A N W A W W O _ UI A A O A DO N - - NUT Diffuser-Jetting Diffuser-Part Stuck in Mold Diffuser-Splay Marks Diffuser-Voids Diffuser-Warpage Diffuser-Weld lines 11 Scroll Base-Black Streaking Scroll Base-Bubble Scroll Base-Burn Spot Scroll Base-Hole Diameter Scroll Base-Mold Flashing Scroll Base-Opening Scroll Base-Part Stuck in Mold Scroll Base-Pin Diameter Scroll Base-Poor Weld Line Scroll Base-Short Shot Scroll Base-Sink Spot Scroll Base-Surface Imperfection Scroll Base-Warpage 6 17 Scroll Wheel Assembly-Black Streaking 206 OFANWO 204 591 Scroll Wheel Assembly-Bubbles 12 Scroll Wheel Assembly-Bum Spot 1 Scroll Wheel Assembly-Missing Teeth 2 Scroll Wheel Assembly-Mold Flashing 6 13 Scroll Wheel Assembly-Part Stuck in Mold 5 12 Scroll Wheel Assembly-Shaft Pin Diameter 11 11 - W N A A S O A W N - - A W N - CI N W W A W N N WO OO OO OO OO NA JA - WA NW - WO - WO W O TOO NA AM - DO D CO N W W A NA 10 32 Scroll Wheel Assembly-Short Shot 220 210 224 654 Scroll Wheel Assembly-Sink Spot 6 2 4 12 Scroll Wheel Assembly-Surface Imperfection Scroll Wheel Assembly-Warpage on N 2 5 3 13 (blank) Grand Total 1207 1213 1200 3620Good Parts Produced Table 2: Statistics of Good Parts Produced Variable Mean SE Mean StDevVariance Minimum 1 Median MaximumRan e Good 587.73 5.03 19.48 379.50 555.00 577.00 586.00 594.00 644.00 89.00 Parts Variable IQR SkewnessKurtosis Good 17.00 1.46 4.95 Parts Run Chart of Good Parts Good Parts i i 3 3 s is r is 5'; 1o 1'1 1'2 1'3 131 1'5- Observation Number of runs about median: 9 Number of runs up or down: 9 Expected number of run: 8.5 Expected number of runs: 9.? Longest run about median: 3 Longest run up or down: 3 Approx P-Value for Clustering: 0.613 Approx PValue for Trends: 0.332 Approx P-Value for Mixtures: 0.38? Approx P-Value for Oscillation: 0.668 Figure 3: Run Chart of Good Parts Produced Off-spec Parts Produced Table 4: Statistics of Off-spec Parts Produced Variable Mean SE Mean StDev Variance Minimum Q1 Median Q3 Maximum Range Offspec 59.40 2.45 9.51 90.40 47.00 51.00 60.00 65.00 79.00 32.00 Parts Variable IQR Skewness Kurtosis Offspec 14.00 0.54 -0.30 Parts 0 Run Chart of Offspec Parts 80 75 70 Offspec Parts 65- 60 55 50 2 3 4 5 6 7 8 9 10 11 12 13 14 15 Observation Number of runs about median: Expected number of runs: 4 Number of runs up or down 10 3.5 7 Longest run about median: 6 Expected number of runs Approx P-Value for Clustering: 0.008 Longest run up or down: Approx P-Value for Trends: 0.586 Approx P-Value for Mixtures: 0.992 Approx P-Value for Oscillation: 0.414 Figure 7: Run Chart of Off-spec Parts ProducedPareto Diagram of Defects total 8000 7000 6000 5000 4000 3000 Parts Defects 2000 1000 0 Pareto Chart of Parts Defects Gran Button-Hole Diam roll Wheel Assembly-Short Shot Croll Wheel Assembly-Black Streaking Diffuser-Intensity Base-Black Streaking Diffuser- Discolora Scroll Base-Hole Hole Diameter Scroll Base-Pin Dia Diameter roll Wheel Assembly-Shaft Pin ter Cover-Shaft Diam mete Percent Scroll Base-Opening Cum % Base-Snap Point Dia ter Base-Snap Point pening Diffuser- Brittleness Figure 9: Pareto Diagram of Defects croll Base-Warpa Base arpag Button- Part Stuck in Mo Button-Warpage Cover-Mold Flashing Cover- Sin pot 100 Diffuser-Part Stuck in Base-Bubble Button-But ble Base-Mold Flashing Button-Mold Flashing 60 Cover Poor Weld Line total 362020654591263254214 35 34 32 31 29 27 26 20 17 16 16 16 16 16 16 16 15 14 14 14 14 13 13 13 351 Scroll Base-Burn Spot 40 Percent Cover- Burn Spot 50 11 9 8 4 4 3 0 0 0 0 0 0 0 0 0 0 0 0 0 0 0 0 0 0 0 0 0 0 0 0 5 Diffuser-Burn Marks 20 50 61 70 79 82 86 89 89 90 90 90 91 91 92 92 92 92 93 93 93 93 93 94 94 94 94 94 95 95 95 95 100 roll Wheel Assembly-Mold Flashing ther 0Probability Plot for Offspec Parts Normal - 95% CI Logistic - 95% CI Goodness of Fit Test 99 Normal AD = 0.294 P-Value = 0.552 Logistic Percent AD = 0.301 50 Percent P-Value > 0.250 Weibull 10 AD = 0.391 10 P-Value > 0.250 Gamma 40 60 80 DOL 40 60 80 101 AD = 0.286 Offspec Parts Offspec Parts P-Value > 0.250 Weibull - 95% CI Gamma - 95% CI 909 Percent 50 14 Percent 10 50 40 60 80 100 Offspec Parts Offspec Parts Figure 8: Probability Plot for Off-spec Parts Produced\f\fTotal Parts Produced Table 1: Statistics of Total Parts Produced SE Variable Mean Mean StDev Variance Minimum Q1 Median Q3 Maximum Total 798.13 4.32 16.73 279.84 776.00 785.00 796.00 808.00 828.00 Parts Variable Binge IQR Skewness Kurtosis Total 52.00 23.00 0.61 -0.72 Parts Run Chart of Total Parts no 1 I I I I I | I | I | | I | 1 2 3 4 5 6 7 8 9 10 11 12 13 14 15 Observation Number of runs about median: 10 Number of runs up or down: 9 Expected number oi runs: 8.5 Expected number of runs: 9.? Longest run about median: 3 Longest run up or down: 2 Approx P-Value for Clustering: 0395 Approx P-Value for Trends: 0.332 Approx PValue for Mixtures: 0.205 Approx PrValue for Oscillation: 0.668 Figure 1: Run Chart of Total Parts Produced