Answered step by step
Verified Expert Solution
Question
1 Approved Answer
Background: Using the random number generator functions in EXCEL allows us to simulate situations in which outcomes are random, and to extract information such as
Background: Using the random number generator functions in EXCEL allows us to simulate situations in which outcomes are random, and to extract information such as how average times are affected by the random nature of the events.
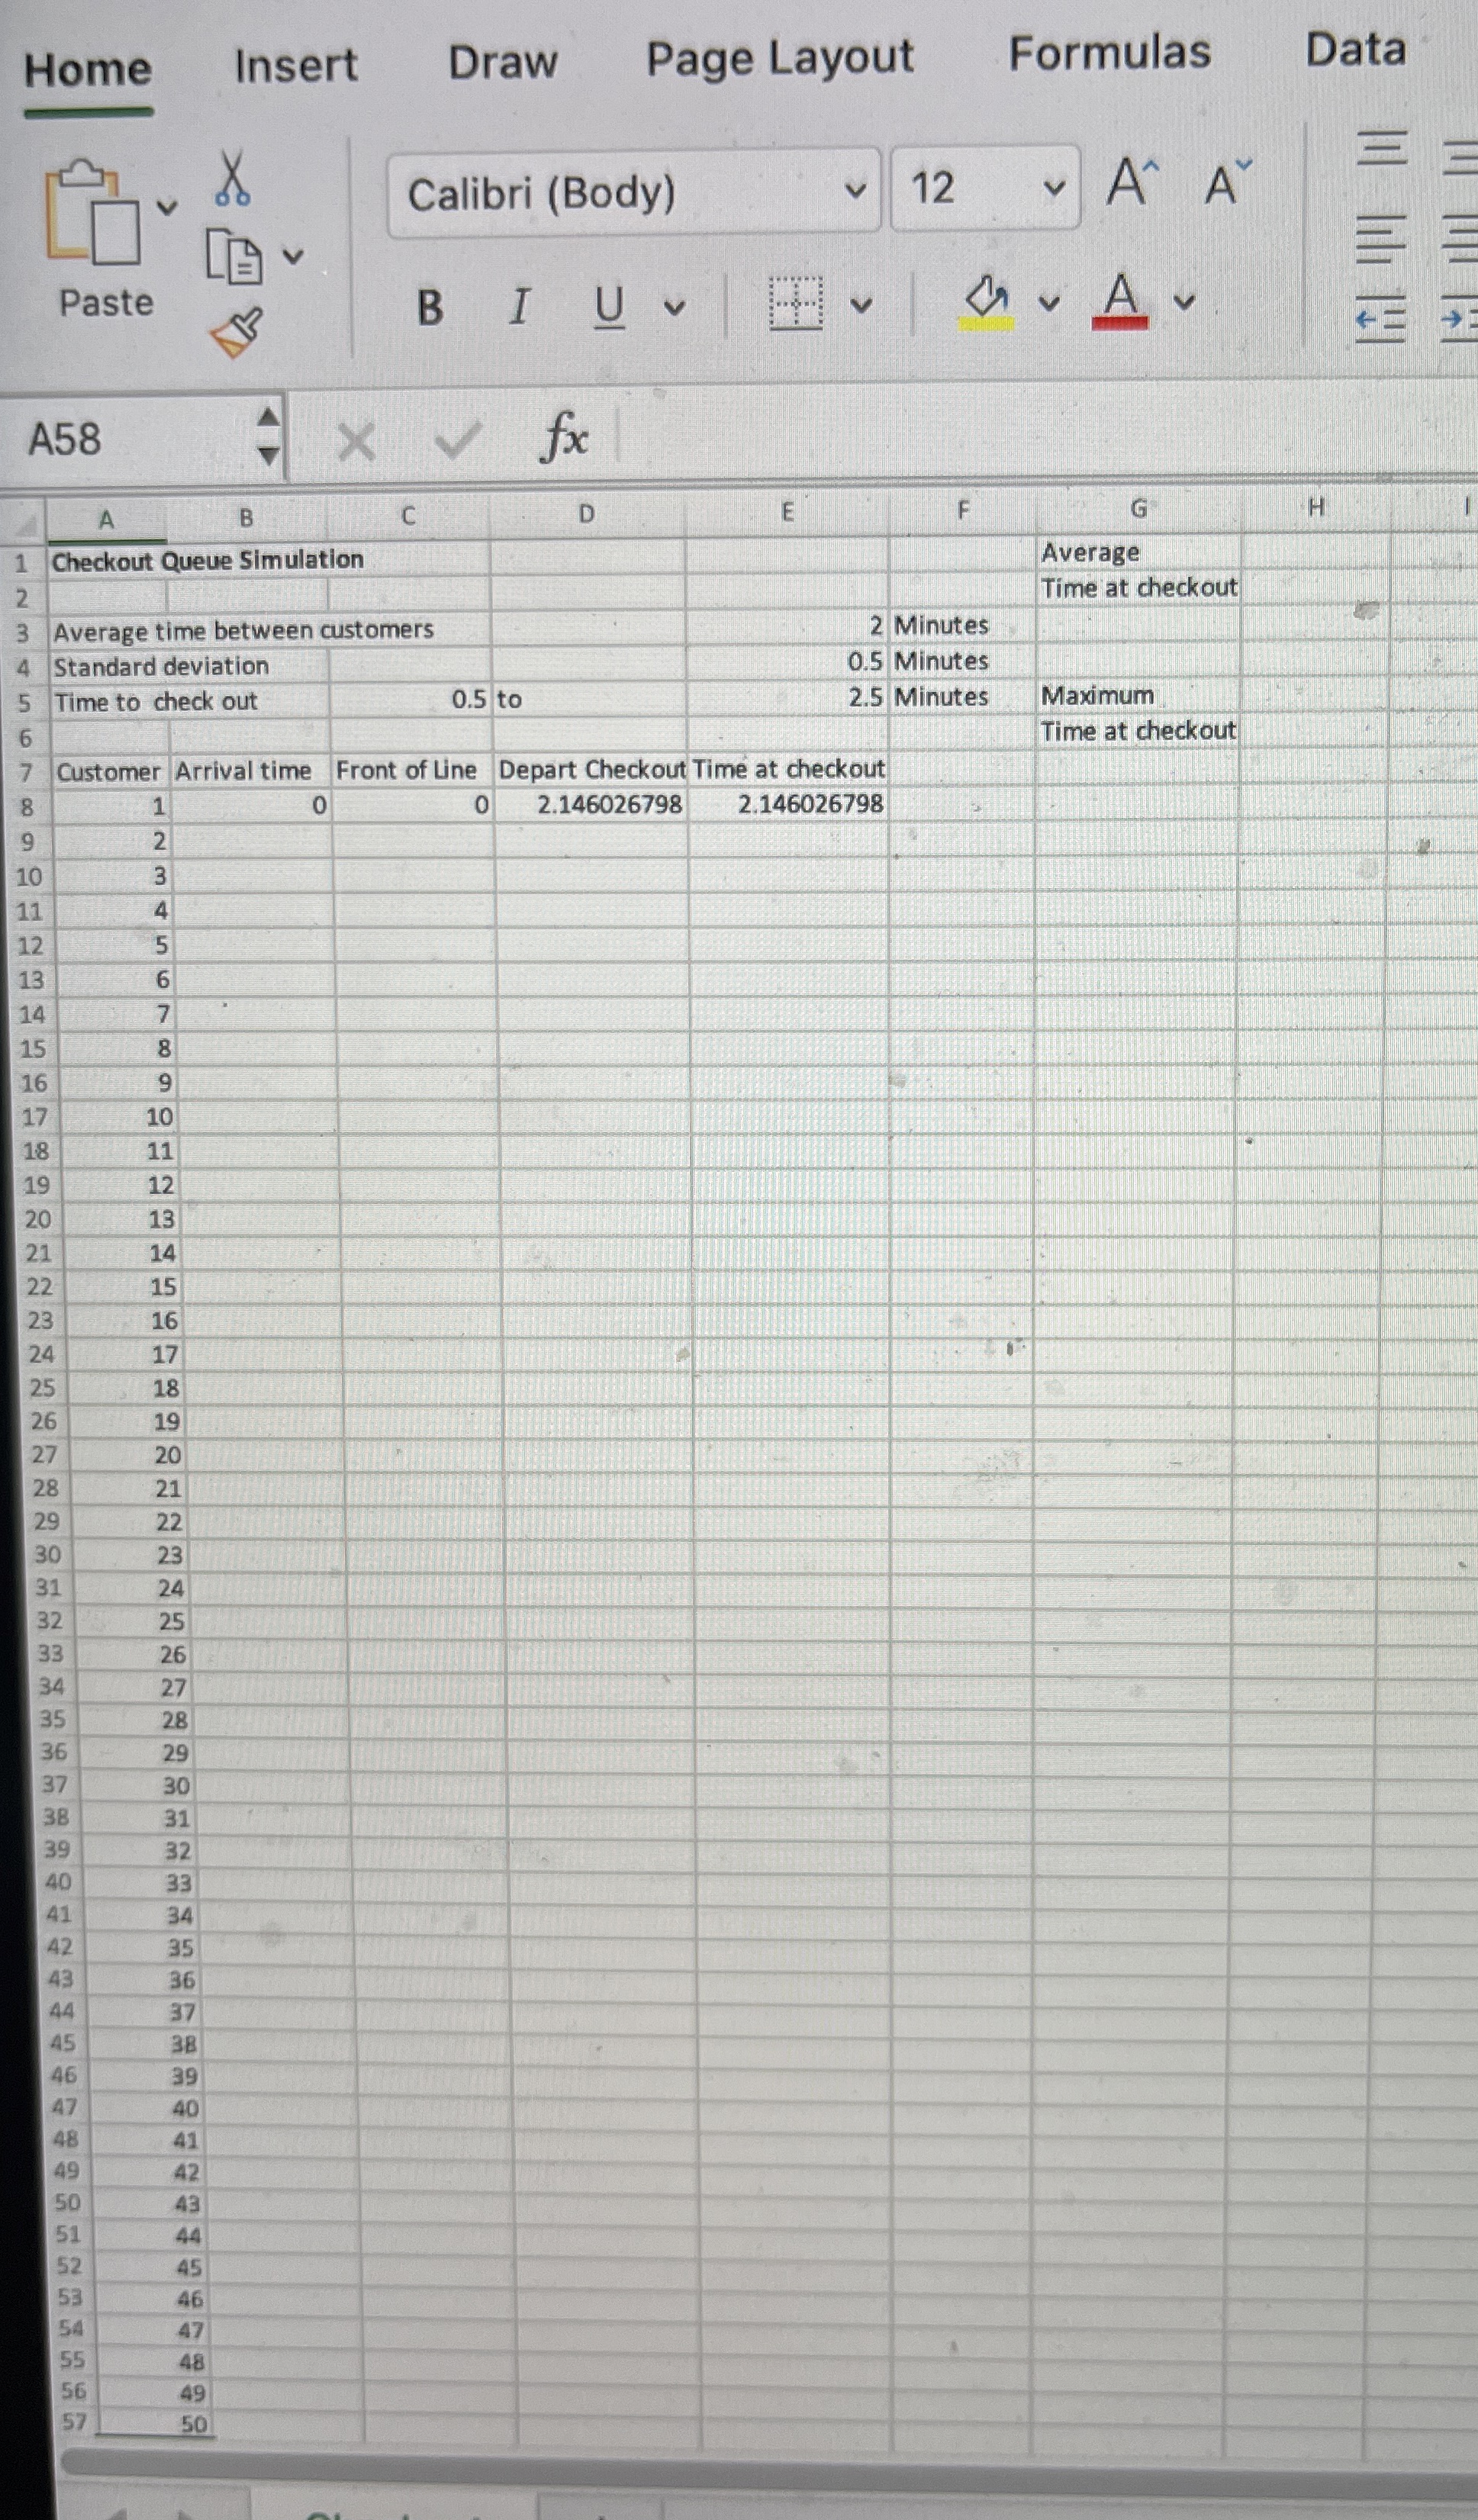
About the lab: In this lab, a simulation is built in EXCEL to simulate the time that customers spend at a grocery store checkout. The purpose of the simulation is to help the store manager decide how many checkouts need to be open at busy times. In the simulation a single checkout line is simulated, however opening more checkouts would affect how often customers arrive at any one checkout so the simulation can be used to see the effects of opening more checkouts by changing the arrival time values. From observations of the current checkouts, the manager knows that the average time between customers arriving at a checkout is minutes with a standard deviation of minutes. The time to complete a customer's check out once they arrive at the front of the queue is uniformly distributed between minutes and minutes. This information is in rows to of the lab template.
The final result of the lab should be a simulation that indicates an average time and maximum time that a customer will spend at a checkout.Directions
In Cell B use NORM.INV to generate a time for Customer to arrive at the checkout. Don't forget that the random time generated by NORM.INV is the time after the previous customer arrived.
In Cell C use the IF function to determine if the previous customer had already finished checking out when this customer arrived and assign the front of line time accordingly.
In Cell D use the RAND function to determine when Customer completes their checkout.
In Cell E calculate the total time the Customer spends at the checkout ie the time from when they first arrive at the checkout queue until they complete the checkout
Copy the formulas in Row to Rows to Row so that the times are simulated for customers.In Cell use the AVERAGE function to calculate the average time a customer spends at the checkout including any wait time
In Cell use the MAX function to calculate the maximum time that any of the customers spend at the checkout.
Save your workbook and submit it through the Moodle page.Home
Insert
Draw
Page Layout
Formulas
Data
A
A
B
C
D
Checkout Queue Simulation
Average time between customers
Standard deviation
Time to check out
Customer Arrival time
Front of Line
D
epart Checkout Time at checkout
table

Step by Step Solution
There are 3 Steps involved in it
Step: 1

Get Instant Access to Expert-Tailored Solutions
See step-by-step solutions with expert insights and AI powered tools for academic success
Step: 2

Step: 3

Ace Your Homework with AI
Get the answers you need in no time with our AI-driven, step-by-step assistance
Get Started


