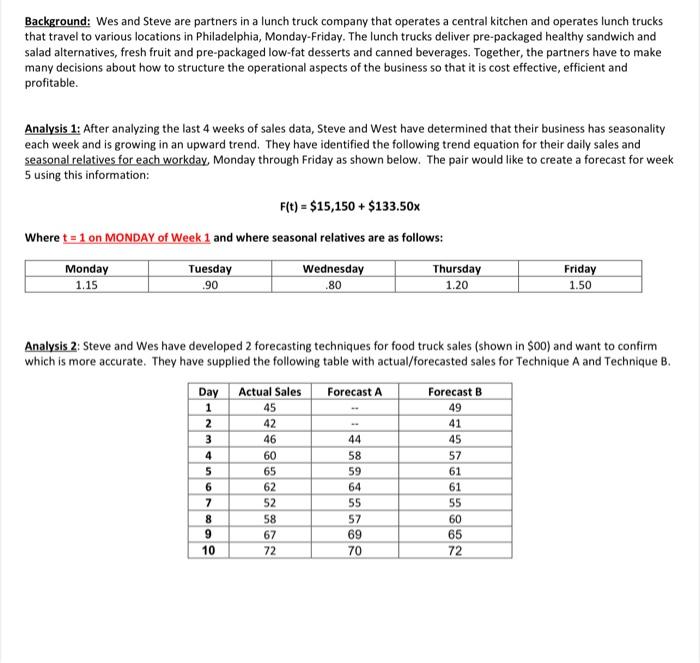
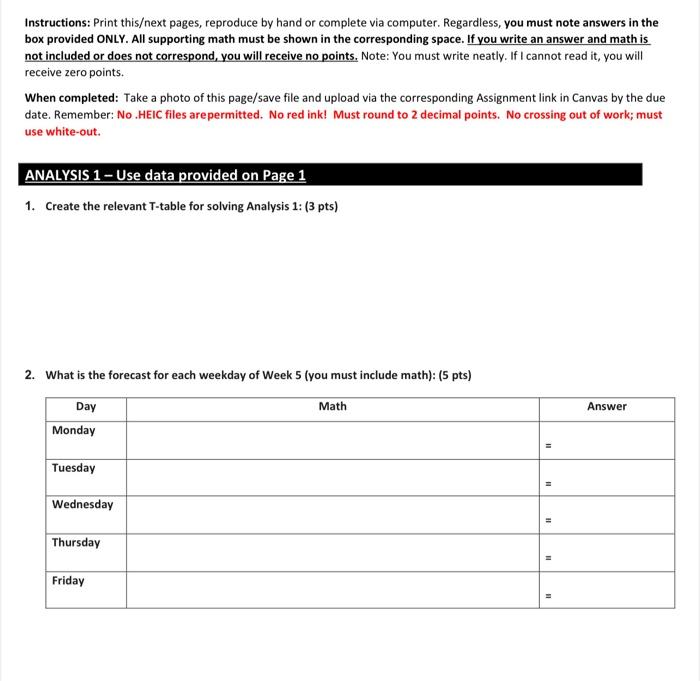
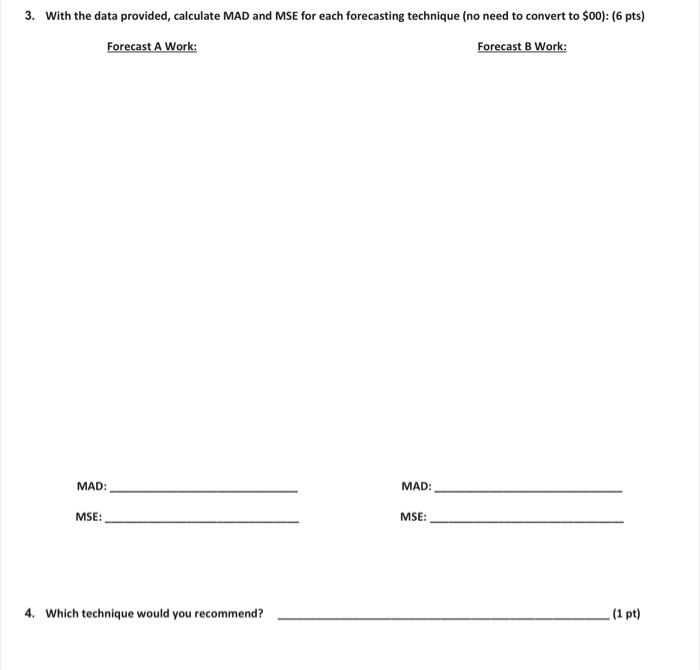
Background: Wes and Steve are partners in a lunch truck company that operates a central kitchen and operates lunch trucks that travel to various locations in Philadelphia, Monday-Friday. The lunch trucks deliver pre-packaged healthy sandwich and salad alternatives, fresh fruit and pre-packaged low-fat desserts and canned beverages. Together, the partners have to make many decisions about how to structure the operational aspects of the business so that it is cost effective, efficient and profitable. Analysis 1: After analyzing the last 4 weeks of sales data, Steve and West have determined that their business has seasonality each week and is growing in an upward trend. They have identified the following trend equation for their daily sales and seasonal relatives for each workday, Monday through Friday as shown below. The pair would like to create a forecast for week 5 using this information: F(t) = $15,150 + $133.50x Where t = 1 on MONDAY of Week 1 and where seasonal relatives are as follows: Monday 1.15 Tuesday .90 Wednesday .80 Friday Thursday 1.20 1.50 Analysis 2: Steve and Wes have developed 2 forecasting techniques for food truck sales (shown in $00) and want to confirm which is more accurate. They have supplied the following table with actual/forecasted sales for Technique A and Technique B. Forecast A Day Actual Sales 1 45 2 42 3 46 4 60 5 65 6 62 7 52 8 58 9 67 10 72 NM on 44 58 59 64 55 57 69 70 Forecast B 49 41 45 57 61 61 55 60 65 72 Instructions: Print thisext pages, reproduce by hand or complete via computer. Regardless, you must note answers in the box provided ONLY. All supporting math must be shown in the corresponding space. If you write an answer and math is not included or does not correspond, you will receive no points. Note: You must write neatly. If I cannot read it, you will receive zero points. When completed: Take a photo of this page/save file and upload via the corresponding Assignment link in Canvas by the due date. Remember: No.HEIC files are permitted. No red ink! Must round to 2 decimal points. No crossing out of work; must use white-out. ANALYSIS 1 - Use data provided on Page 1 1. Create the relevant T-table for solving Analysis 1: (3 pts) 2. What is the forecast for each weekday of Week 5 (you must include math): (5 pts) Math Answer Day Monday Tuesday Wednesday HI Thursday Friday 3. With the data provided, calculate MAD and MSE for each forecasting technique (no need to convert to $00): (6 pts) Forecast A Work: Forecast B Work: MAD: MAD: MSE: MSE: 4. Which technique would you recommend? (1 pt) Background: Wes and Steve are partners in a lunch truck company that operates a central kitchen and operates lunch trucks that travel to various locations in Philadelphia, Monday-Friday. The lunch trucks deliver pre-packaged healthy sandwich and salad alternatives, fresh fruit and pre-packaged low-fat desserts and canned beverages. Together, the partners have to make many decisions about how to structure the operational aspects of the business so that it is cost effective, efficient and profitable. Analysis 1: After analyzing the last 4 weeks of sales data, Steve and West have determined that their business has seasonality each week and is growing in an upward trend. They have identified the following trend equation for their daily sales and seasonal relatives for each workday, Monday through Friday as shown below. The pair would like to create a forecast for week 5 using this information: F(t) = $15,150 + $133.50x Where t = 1 on MONDAY of Week 1 and where seasonal relatives are as follows: Monday 1.15 Tuesday .90 Wednesday .80 Friday Thursday 1.20 1.50 Analysis 2: Steve and Wes have developed 2 forecasting techniques for food truck sales (shown in $00) and want to confirm which is more accurate. They have supplied the following table with actual/forecasted sales for Technique A and Technique B. Forecast A Day Actual Sales 1 45 2 42 3 46 4 60 5 65 6 62 7 52 8 58 9 67 10 72 NM on 44 58 59 64 55 57 69 70 Forecast B 49 41 45 57 61 61 55 60 65 72 Instructions: Print thisext pages, reproduce by hand or complete via computer. Regardless, you must note answers in the box provided ONLY. All supporting math must be shown in the corresponding space. If you write an answer and math is not included or does not correspond, you will receive no points. Note: You must write neatly. If I cannot read it, you will receive zero points. When completed: Take a photo of this page/save file and upload via the corresponding Assignment link in Canvas by the due date. Remember: No.HEIC files are permitted. No red ink! Must round to 2 decimal points. No crossing out of work; must use white-out. ANALYSIS 1 - Use data provided on Page 1 1. Create the relevant T-table for solving Analysis 1: (3 pts) 2. What is the forecast for each weekday of Week 5 (you must include math): (5 pts) Math Answer Day Monday Tuesday Wednesday HI Thursday Friday 3. With the data provided, calculate MAD and MSE for each forecasting technique (no need to convert to $00): (6 pts) Forecast A Work: Forecast B Work: MAD: MAD: MSE: MSE: 4. Which technique would you recommend? (1 pt)