Answered step by step
Verified Expert Solution
Question
1 Approved Answer
Background: Wes and Steve are partners in a lunch truck company that operates a central kitchen and operates lunch trucks that travel to various


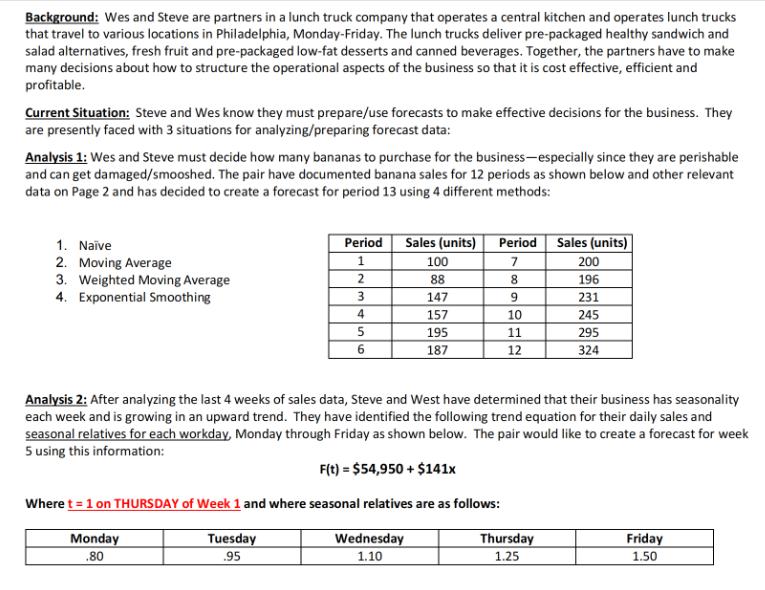
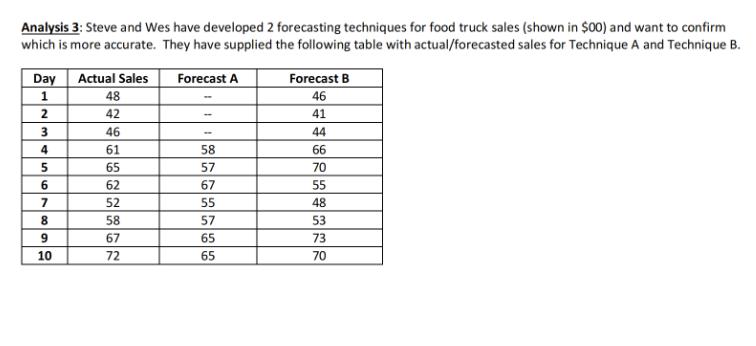
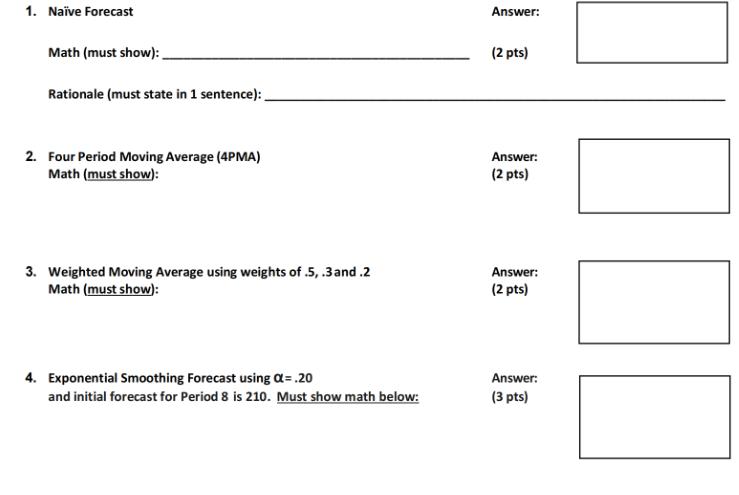
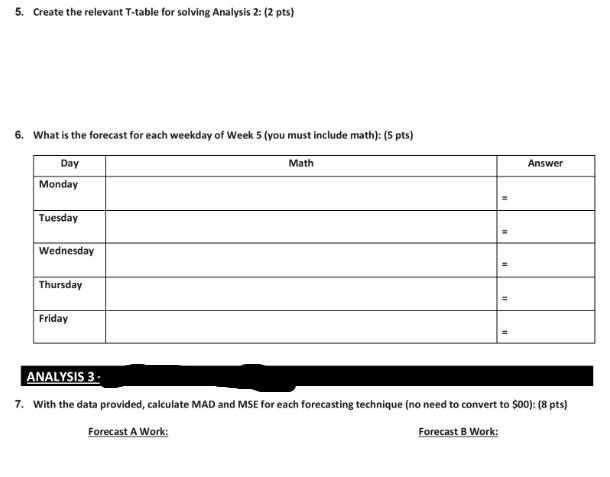
Background: Wes and Steve are partners in a lunch truck company that operates a central kitchen and operates lunch trucks that travel to various locations in Philadelphia, Monday-Friday. The lunch trucks deliver pre-packaged healthy sandwich and salad alternatives, fresh fruit and pre-packaged low-fat desserts and canned beverages. Together, the partners have to make many decisions about how to structure the operational aspects of the business so that it is cost effective, efficient and profitable. Current Situation: Steve and Wes know they must prepare/use forecasts to make effective decisions for the business. They are presently faced with 3 situations for analyzing/preparing forecast data: Analysis 1: Wes and Steve must decide how many bananas to purchase for the business-especially since they are perishable and can get damaged/smooshed. The pair have documented banana sales for 12 periods as shown below and other relevant data on Page 2 and has decided to create a forecast for period 13 using 4 different methods: 1. Nave 2. Moving Average 3. Weighted Moving Average 4. Exponential Smoothing Period Sales (units) 1 2 3 4 Monday .80 5 6 Tuesday .95 100 88 147 157 195 187 Where t = 1 on THURSDAY of Week 1 and where seasonal relatives are as follows: Period 7 8 9 Analysis 2: After analyzing the last 4 weeks of sales data, Steve and West have determined that their business has seasonality each week and is growing in an upward trend. They have identified the following trend equation for their daily sales and seasonal relatives for each workday, Monday through Friday as shown below. The pair would like to create a forecast for week 5 using this information: F(t) = $54,950+ $141x Wednesday 1.10 10 11 12 Sales (units) 200 196 231 245 295 324 Thursday 1.25 Friday 1.50 Analysis 3: Steve and Wes have developed 2 forecasting techniques for food truck sales (shown in $00) and want to confirm which is more accurate. They have supplied the following table with actual/forecasted sales for Technique A and Technique B. Day 1 2 3 4 5 6 7 8 9 10 Actual Sales 48 42 46 61 65 62 52 58 67 72 Forecast A - 58 57 67 55 57 65 65 Forecast B 46 41 44 66 70 55 48 53 73 70 1. Nave Forecast Math (must show): Rationale (must state in 1 sentence): 2. Four Period Moving Average (4PMA) Math (must show): 3. Weighted Moving Average using weights of .5, .3 and.2 Math (must show): 4. Exponential Smoothing Forecast using a =.20 and initial forecast for Period 8 is 210. Must show math below: Answer: (2 pts) Answer: (2 pts) Answer: (2 pts) Answer: (3 pts) 5. Create the relevant T-table for solving Analysis 2: (2 pts) 6. What is the forecast for each weekday of Week 5 (you must include math): (5 pts) Day Monday Tuesday Wednesday Thursday Friday Math = = = Answer ANALYSIS 3. 7. With the data provided, calculate MAD and MSE for each forecasting technique (no need to convert to $00): (8 pts) Forecast A Work: Forecast B Work:
Step by Step Solution
There are 3 Steps involved in it
Step: 1
You provided images with information regarding forecasting techniques for sales data There is a lot of work involved in the forecasting part so Im going to break it down into steps for each analysis a...
Get Instant Access to Expert-Tailored Solutions
See step-by-step solutions with expert insights and AI powered tools for academic success
Step: 2

Step: 3

Ace Your Homework with AI
Get the answers you need in no time with our AI-driven, step-by-step assistance
Get Started


