

Answered step by step
Verified Expert Solution
Question
1 Approved Answer
balance sheet provided What is United's Price to Earnings ratio for 2017 if the share price was $84? 10.6 B 8.5 C 11.1 D) 8.9
balance sheet provided 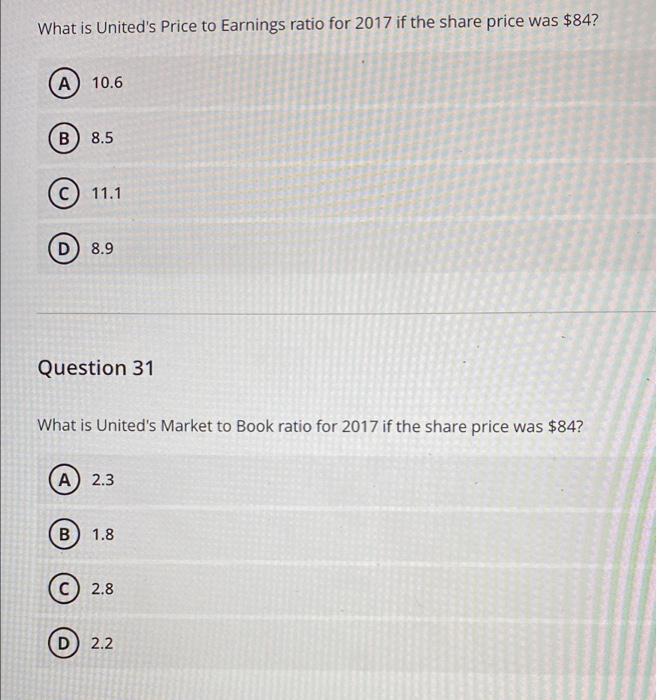
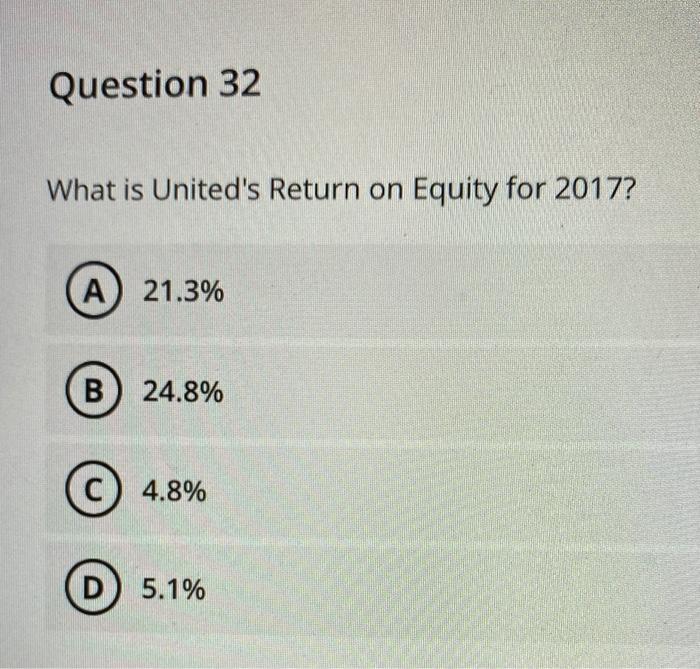
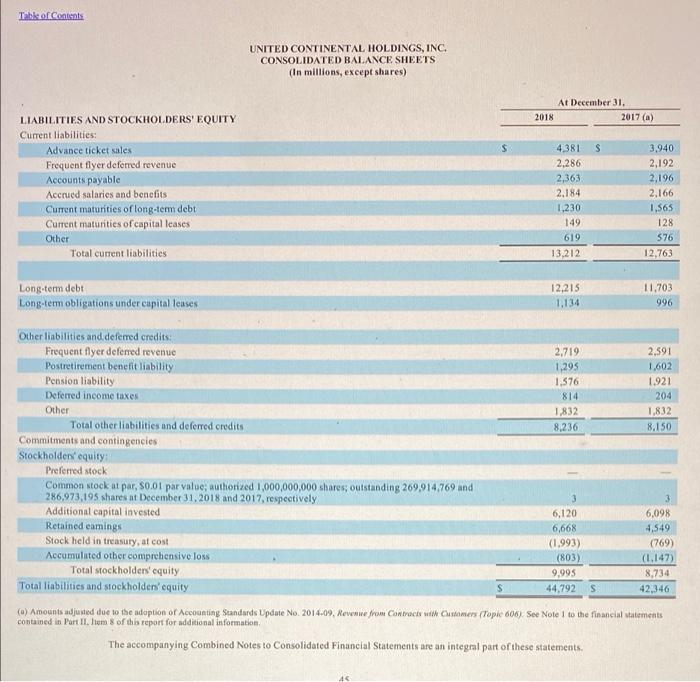
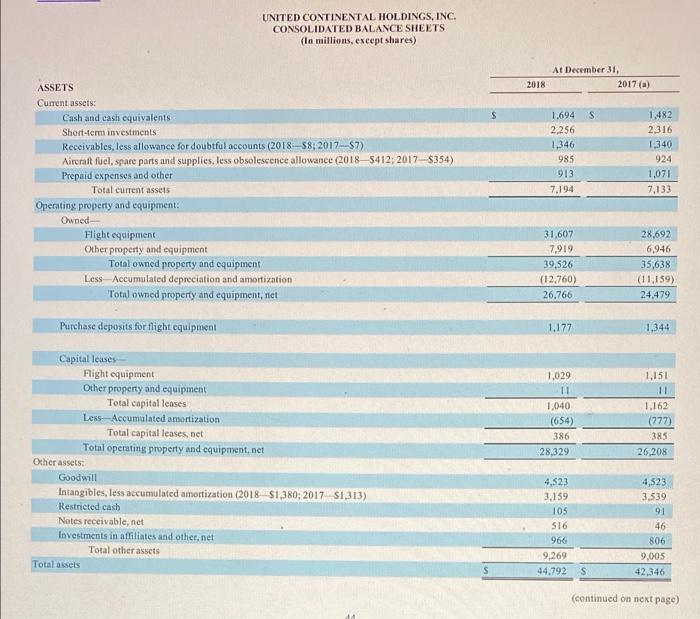
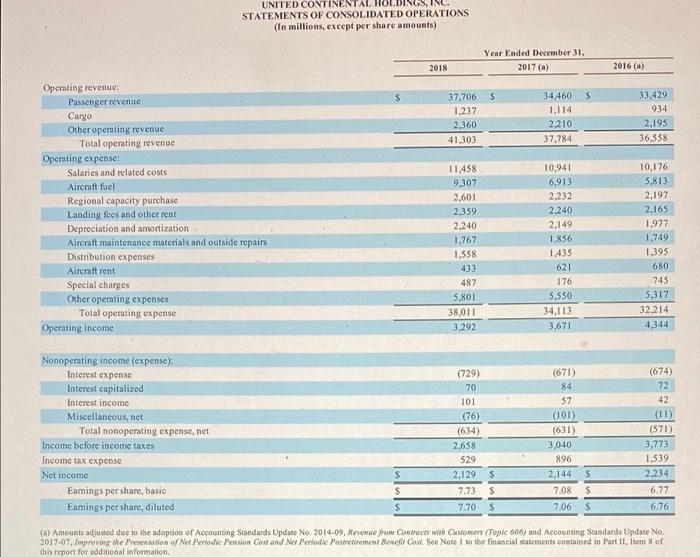
What is United's Price to Earnings ratio for 2017 if the share price was $84? 10.6 B 8.5 C 11.1 D) 8.9 Question 31 What is United's Market to Book ratio for 2017 if the share price was $84? A 2.3 B 1.8 2.8 D) 2.2 Question 32 What is United's Return on Equity for 2017? A 21.3% B 24.8% C 4.8% D 5.1% Table of Contents UNITED CONTINENTAL HOLDINGS, INC. CONSOLIDATED BALANCE SHEETS (In millions, except shares) At December 31. 2017(a) 2018 $ $ LIABILITIES AND STOCKHOLDERS' EQUITY Current liabilities: Advance ticket sales Frequent flyer deferred revenue Accounts payable Accrued salaries and benefits Current maturities of long-term debt Current maturities of capital leases Other Total current liabilities 3,940 2,192 2,196 2,166 4381 2.286 2,363 2.184 1,230 149 619 13,212 1,565 128 576 12,763 12,215 Long-term debt Long-term obligations under capital lenses 11.703 996 Other liabilities and deferred credits: Frequent flyer deferred revenue 2,719 2,591 Postretirement benefit liability 1,295 1.602 Pension liability 1,576 1.921 Deferred income taxes 814 204 Other 1,832 1,832 Total other liabilities and deferred credits 8,236 8.150 Commitments and contingencies Stockholders' equity Preferred stock Common stock at par, 30.01 par value, authorized 1,000,000,000 shares; outstanding 269,914 769 and 286,973,195 shares at December 31, 2018 and 2017, respectively 3 Additional capital invested 6,120 6,098 Retained eamings 6,668 4,549 Stock held in treasury, at cost (1.993) (769) Accumulated other comprehensive loss (803) (1,147) Total stockholders' equity 9.995 8,734 Total liabilities and stockholders' equity 44,792 42,346 (a) Amounts adjusted due to the adoption of Accounting Standards Update No. 2014.09, Rowme from Contract with Customers topie 606) See Note I to the financial statements contained in Part II. liom 8 of the report for additional information The accompanying Combined Notes to Consolidated Financial Statements are an integral part of these statements. UNITED CONTINENTAL HOLDINGS, INC. CONSOLIDATED BALANCE SHEETS (In millions, except shares) At December 31, 2017 (a) 2018 S s ASSETS Cument assets: Cash and cash equivalents Short-term investments Receivables, less allowance for doubtful accounts (2018-58; 2017-$7) Aircraft fuel, spare parts and supplies, less obsolescence allowance (2018_5412: 2017-5354) Prepaid expenses and other Total current assets Operating property and equipment: Owned Flight equipment Other property and equipment Total owned property and equipment Less - Accumulated depreciation and amortization Total owned property and equipment, niet 1.694 2.256 1,346 98.5 913 7.194 1,482 2.316 1,340 924 1,071 7.133 31,607 7,919 39,526 (12.760) 26.766 28,692 6,946 35,638 (11,159) 24,479 Purchase deposits for flight equipment 1.177 1.344 1,029 11 1,040 (654) 386 28,329 1.151 11 1.162 (777) 385 26 208 Capital leases Flight equipment Other property and equipment Total capital leases Less Accumulated amortization Total capital leases, net Total operating property and equipment, net Other assets Goodwill Intangibles, less accumulated amortization (2018 $1,380, 2017 S1,313) Restricted cash Notes receivable, net Investments in affiliates and other net Total other assets Total assets 4,523 3.159 105 516 966 9,269 44.792 4,523 3,539 91 46 806 9.005 42,346 S S (continued on next page) UNITED CONTINENTAL STATEMENTS OF CONSOLIDATED OPERATIONS (in millions, except per share amounts) Year Ended December 31, 2017(a) 2018 2016 (6) s s 37,706 1.237 2,360 41.303 34,460 1,114 2,210 37,784 33.429 934 2.195 36,558 Operating revenue: Passenger revenue Cargo Other operating revenue Total operating revenue Operating expense: Salaries and related costs Aircraft fuel Regional capacity purchase Landing fees and other rent Depreciation and amortization Aircraft maintenance materials and outside repairs Distribution expenses Aircraft rent Special charges Other operating expenses Total operating expense Operating income 11458 9,307 2,601 2,359 2.240 1.767 1.558 433 10,941 6,913 2,232 2,240 2,149 1,856 1.435 621 176 5,550 34.113 3,671 10,176 5.813 2,197 2.165 1.977 1.749 1.395 680 745 5,317 32.214 4,344 487 5.801 38,011 3,292 Nonoperating income (expense) Interest expense Interest capitalized Interest income Miscellaneous, net Total nonoperating expense, net Income before income taxes Income tax expense Net income Eamings per share, basic Eamings per share, diluted (729) 70 101 (76) (634) 2,658 529 2.129 7.73 7.70 (671) 84 37 (101) (631) 3,040 896 2.144 7.08 5 7.06 S (674) 72 42 (11) (571) 3,773 1.539 2.234 6.77 6.76 S S S S S S (a) Amounts adjusted doc to the adoption of Accounting Standards Update No. 2014-09, Rome from Contract with domes Tople 606) and Accounting Sandards Update No. 2017-07. Improving the Premation of Net Periodie Pension Cost and Ner Periodic Portement Benefit Cout. See Note to the financial statements contained in Part II. Item 8 of this report for additional information Step by Step Solution
There are 3 Steps involved in it
Step: 1

Get Instant Access to Expert-Tailored Solutions
See step-by-step solutions with expert insights and AI powered tools for academic success
Step: 2

Step: 3
Ace Your Homework with AI
Get the answers you need in no time with our AI-driven, step-by-step assistance
Get Started
Gender And Finance
Authors: Ylva Baeckström
1st Edition
103205557X, 978-1032055572