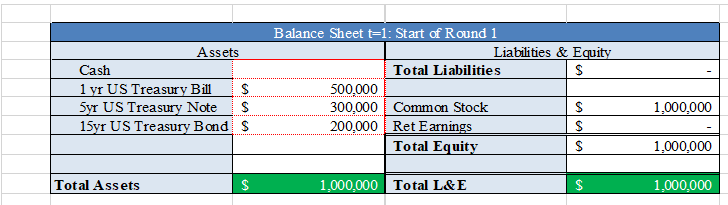
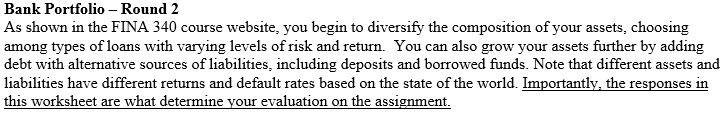
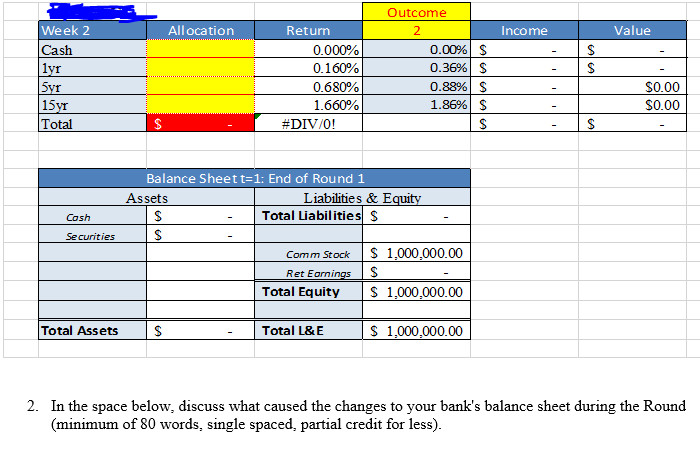
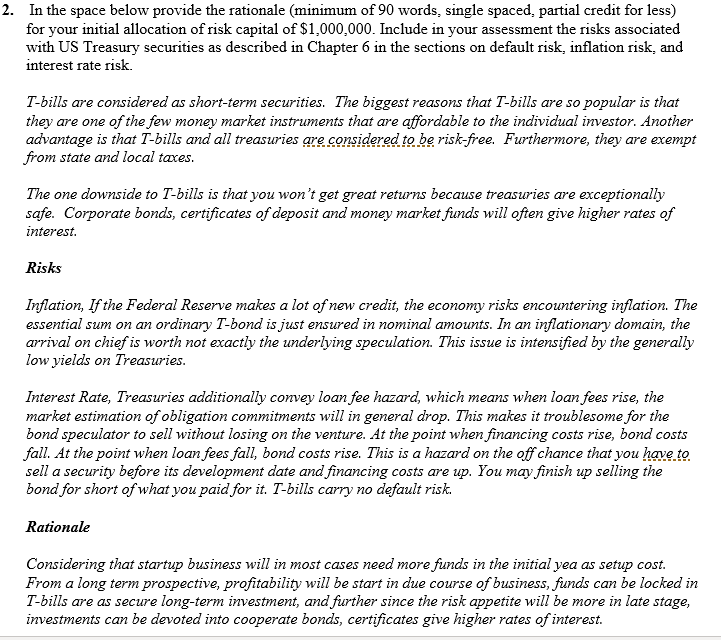
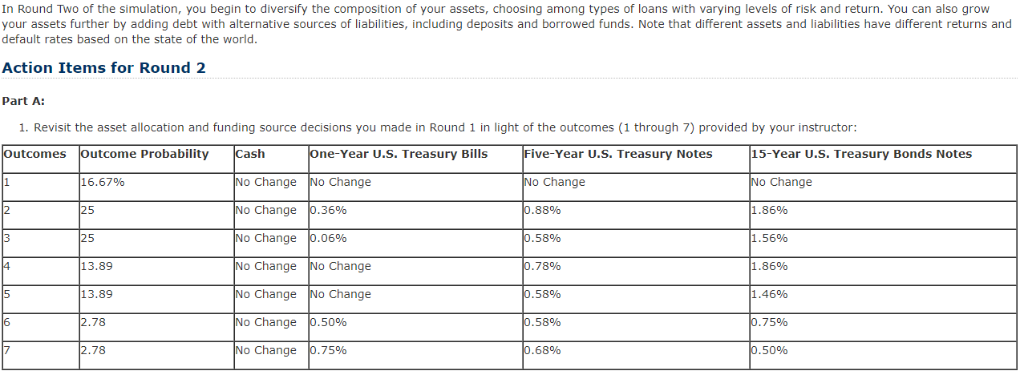
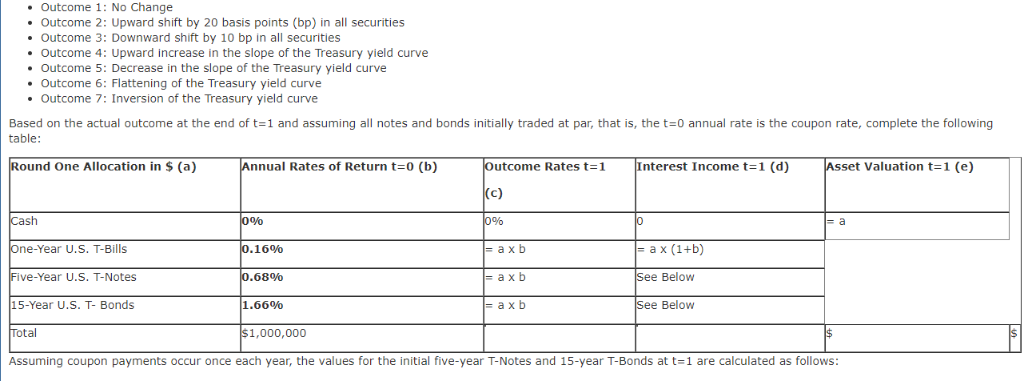
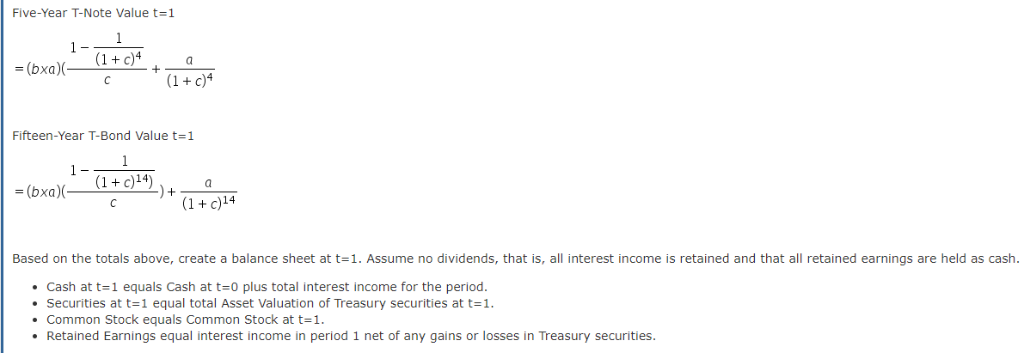
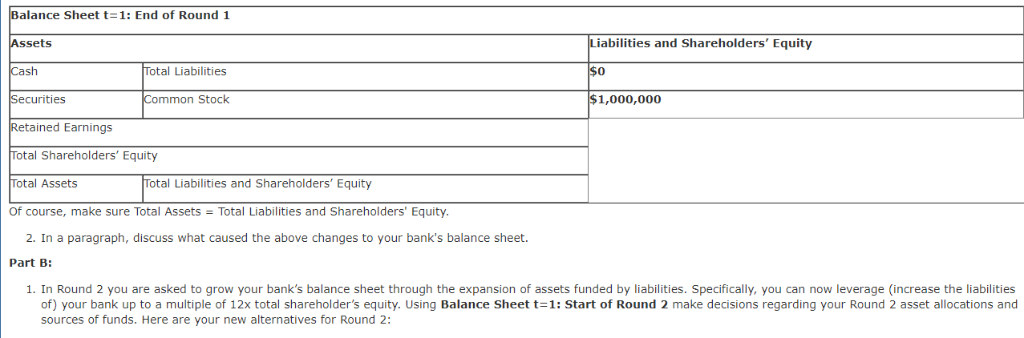
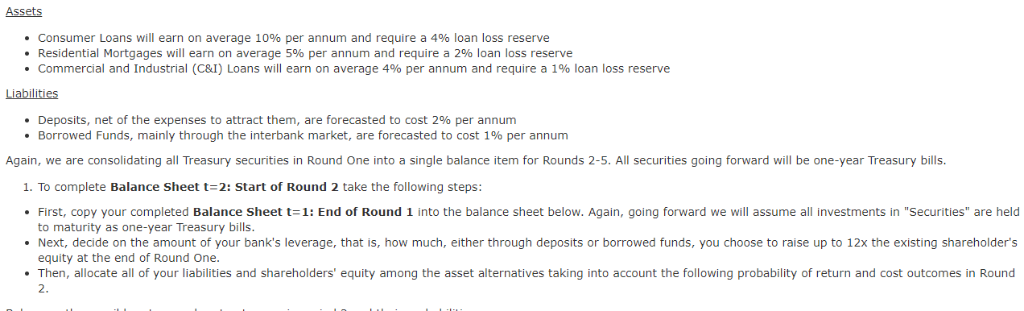
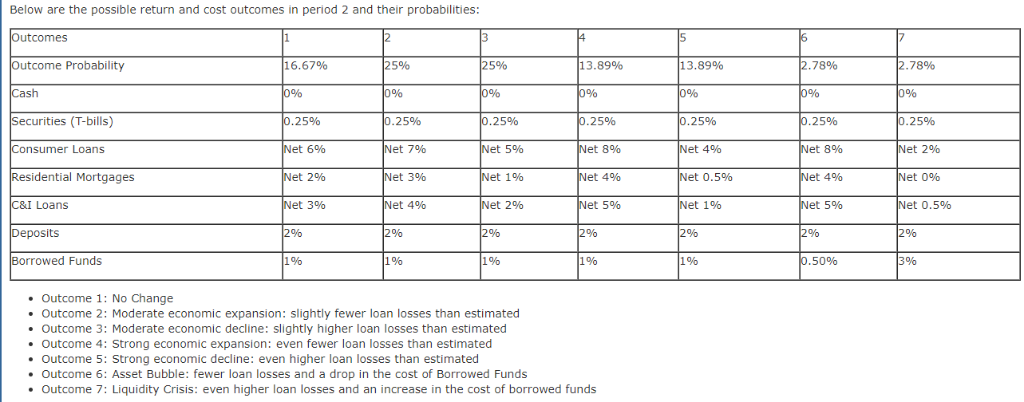
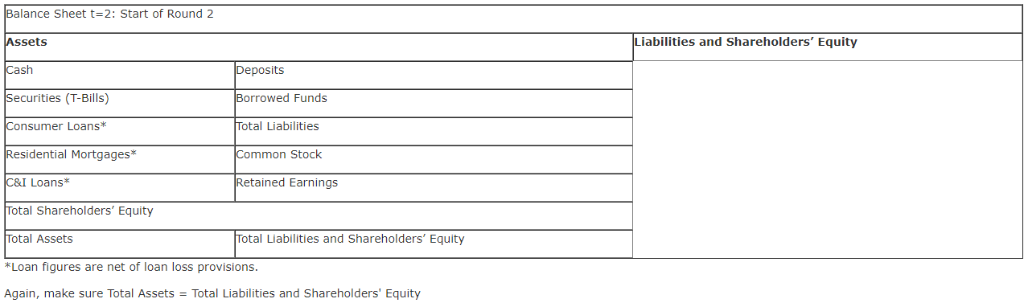
Balance Sheet t-1: Start of Round 1 Assets Cash 1 yr US Treasury Bill$ 5yr US Treasury NoteS 15yr US Treasury Bond S Total Liabilities 500,000 300,000 Common Stock 200,000 Ret Earnings 1,000,000 Total Equit 1,000,000 Total Assets 1,000,000 0,000 Total L&E 1.000,000 Bank Portfolio - Round 2 As shown in the FINA 340 course website, you begin to diversify the composition of your assets, choosing among types of loans with varying levels of risk and return. You can also grow your assets further by adding debt with alternative sources of liabilities, including deposits and borrowed funds. Note that different assets and liabilities have different returns and default rates based on the state of the world. Importantly, the responses in Outcome Week 2 Cash yr All ocation Return Income Value 0.000% 0.160% 0.680% 1.660% 0.00%| 0.36%) 0.88%) 1.86%) $ $ $ $ 15yr Total S0.00 #DIV/0! Balance Sheett-1: End of Round 1 Assets Liabilities & E Cosh Total Liabilities S Securities Comm Stock S 1,000,000.00 Total Equity S 1,000,000.00 S 1,000,000.00 Ret Eami Total Assets S Total L& E 2. In the space below, discuss what caused the changes to your bank's balance sheet during the Round (minimum of 80 words, single spaced, partial credit for less) 2. In the space below provide the rationale (minimum of 90 words, single spaced, partial credit for less) for your initial allocation of risk capital of $1,000,000. Include in your assessment the risks associated with US Treasury securities as described in Chapter 6 in the sections on default risk, inflation risk, and interest rate risk. T-bills are considered as short-term securities. The biggest reasons that T-bills are so popular is that they are one of the few money market instruments that are affordable to the individual investor. Another advantage is that T-bills and all treasuries are considered to.be risk-free. Furthermore, they are exempt from state and local taxes The one downside to T-bills is that you won't get great returns because treasuries are exceptionally safe. Corporate bonds, certificates of deposit and money market funds will often give higher rates of nterest. Risks Inflation, If the Federal Reserve makes a lot of new credit, the economy risks encountering inflation. The essential sum on an ordinary T-bond is just ensured in nominal amounts. In an inflationary domain, the arrival on chief is worth not exactly the underlying speculation. This issue is intensified by the generally low vields on Ireasuries Interest Rate, Treasuries additionally convey loan fee hazard, which means when loan fees rise, the market estimation ofobligation commitments will in general drop. This makes it troublesome for the bond speculator to sell without losing on the venture. At the point whenfinancing costs rise, bond costs fall. At the point when loan fees fall, bond costs rise. This is a hazard on the offchance that you have to sell a security before its development date and financing costs are up. You may finish up selling the bond for short of what you paid for it. T-bills carry no default risk. Rationale Considering that startup business will in most cases need more funds in the initial yea as setup cost. From a long term prospective, profitability will be start in due course of business, funds can be locked in T-bills are as secure long-term investment, and further since the risk appetite will be more in late stage, investments can be devoted into cooperate bonds, certificates give higher rates ofinterest In Round Two of the simulation, you begin to diversify the composition of your assets, choosing among types of loans with varying levels of risk and return. You can also grow your assets further by adding debt with alternative sources of liabilities, including deposits and borrowed funds. Note that different assets and liabilities have different returns and default rates based on the state of the world Action Items for Round 2 Part A: 1. Revisit the asset allocation and funding source decisions you made in Round 1 in light of the outcomes (1 through 7) provided by your instructor: utcomes Outcome Probability ash No Change No Change No Change .36% No Change 0.06% No Change No Change No Change No Change No Change .5096 No Change .7596 ne-Year U.S. Treasury Bills ive-Year U.S. Treasury Notes o Change 88% 58% 15-Year U.S. Treasury Bonds Notes 16.67% o Change 25 25 13.89 13.89 78% 58% 5896 68% 86% 1. 5696 1.86% 1.46% 75% 50% 78 78 Outcome 1: No Change Outcome 2: Upward shift by 20 basis points (bp) in all securities . Outcome 3: Downward shift by 10 bp in all securities . Outcome 4: Upward increase in the slope of the Treasury yield curve Outcome 5: Decrease in the slope of the Treasury yield curve Outcome 6: Flattening of the Treasury yield curve Outcome 7: Inversion of the Treasury yield curve Based on the actual outcome at the end of t1 and assuming all notes and bonds initially traded at par, that is, the t 0 annual rate is the coupon rate, complete the following table ound One Allocation in $ (a) nnual Rates of Return t-0 (b) utcome Rates t 1 Interest Income t 1 (d) sset Valuation t-1 (e) c) ash ne-Year U.S. T-Bills 16% a x b a x b a x b ive-Year U.S. T-Notes 68%0 Below 15-Year U.S. T- Bonds 1.66% Below otal 1,000,000 Assuming coupon payments occur once each year, the values for the initial five-year T-Notes and 15-year T-Bonds at t1 are calculated as follows Balance Sheet t-1: End of Round 1 Assets et Securities iabilities and Shareholders' Equity otal Liabilities Common Stock $1,000,000 etained Earnings Total Shareholders' Equity otal Assets otal Liabilities and Shareholders' Equity Of course, make sure Total Assets Total Liabilities and Shareholders' Equity 2. In a paragraph, discuss what caused the above changes to your bank's balance sheet Part B: 1. In Round 2 you are asked to grow your bank's balance sheet through the expansion of assets funded by liabilities. Specifically, you can now leverage (increase the liabilities of) your bank up to a multiple of 12x total shareholder's equity. Using Balance Sheet sources of funds. Here are your new alternatives for Round 2: 1: Start of Round 2 make decisions regarding your Round 2 asset allocations and Below are the possible return and cost outcomes in period 2 and their probabilities: comes tcome Probability 16.67% 5% 5%% 13 . 89% 13.89% 78% 78% curities (T-bills) 25% et 6% et 2% et 3% 25% et 7% Net 3% et 4% 25% et 5% et1% et 2% 25% et 8% et 4% et 5% 25% 25% et 8% et 4% et 5% 25% et 2% Net 096 nsumer Loans et 4% sidential Mortgages Net 0.5% I Loans Net 1% et 0,5% eposits rrowed Funds 1% 196 190 1% 50% 396 Outcome 1: No Change Outcome 2: Moderate economic expansion: slightly fewer loan losses than estimated . Outcome 3: Moderate economic decline: slightly higher loan losses than estimated . Outcome 4: Strong economic expansion: even fewer loan losses than estimated . Outcome 5: Strong economic decline: even higher loan losses than estimated .Outcome 6: Asset Bubble: fewer loan losses and a drop in the cost of Borrowed Funds Outcome 7: Liquidity Crisis: even higher loan losses and an increase in the cost of borrowed funds alance Sheet t= 2: Start of Round 2 Liabilities and Shareholders Equity Securities (T-Bills) onsumer Loans Residential Mortgages C&I Loans otal Shareholders' Equity otal Assets *Loan figures are net of loan loss provisions Again, make sure Total Assets Total Liabilities and Shareholders' Equity Borrowed Funds Total Liabilities Common Stock Retained Earnings otal Liabilities and Shareholders' Equity Balance Sheet t-1: Start of Round 1 Assets Cash 1 yr US Treasury Bill$ 5yr US Treasury NoteS 15yr US Treasury Bond S Total Liabilities 500,000 300,000 Common Stock 200,000 Ret Earnings 1,000,000 Total Equit 1,000,000 Total Assets 1,000,000 0,000 Total L&E 1.000,000 Bank Portfolio - Round 2 As shown in the FINA 340 course website, you begin to diversify the composition of your assets, choosing among types of loans with varying levels of risk and return. You can also grow your assets further by adding debt with alternative sources of liabilities, including deposits and borrowed funds. Note that different assets and liabilities have different returns and default rates based on the state of the world. Importantly, the responses in Outcome Week 2 Cash yr All ocation Return Income Value 0.000% 0.160% 0.680% 1.660% 0.00%| 0.36%) 0.88%) 1.86%) $ $ $ $ 15yr Total S0.00 #DIV/0! Balance Sheett-1: End of Round 1 Assets Liabilities & E Cosh Total Liabilities S Securities Comm Stock S 1,000,000.00 Total Equity S 1,000,000.00 S 1,000,000.00 Ret Eami Total Assets S Total L& E 2. In the space below, discuss what caused the changes to your bank's balance sheet during the Round (minimum of 80 words, single spaced, partial credit for less) 2. In the space below provide the rationale (minimum of 90 words, single spaced, partial credit for less) for your initial allocation of risk capital of $1,000,000. Include in your assessment the risks associated with US Treasury securities as described in Chapter 6 in the sections on default risk, inflation risk, and interest rate risk. T-bills are considered as short-term securities. The biggest reasons that T-bills are so popular is that they are one of the few money market instruments that are affordable to the individual investor. Another advantage is that T-bills and all treasuries are considered to.be risk-free. Furthermore, they are exempt from state and local taxes The one downside to T-bills is that you won't get great returns because treasuries are exceptionally safe. Corporate bonds, certificates of deposit and money market funds will often give higher rates of nterest. Risks Inflation, If the Federal Reserve makes a lot of new credit, the economy risks encountering inflation. The essential sum on an ordinary T-bond is just ensured in nominal amounts. In an inflationary domain, the arrival on chief is worth not exactly the underlying speculation. This issue is intensified by the generally low vields on Ireasuries Interest Rate, Treasuries additionally convey loan fee hazard, which means when loan fees rise, the market estimation ofobligation commitments will in general drop. This makes it troublesome for the bond speculator to sell without losing on the venture. At the point whenfinancing costs rise, bond costs fall. At the point when loan fees fall, bond costs rise. This is a hazard on the offchance that you have to sell a security before its development date and financing costs are up. You may finish up selling the bond for short of what you paid for it. T-bills carry no default risk. Rationale Considering that startup business will in most cases need more funds in the initial yea as setup cost. From a long term prospective, profitability will be start in due course of business, funds can be locked in T-bills are as secure long-term investment, and further since the risk appetite will be more in late stage, investments can be devoted into cooperate bonds, certificates give higher rates ofinterest In Round Two of the simulation, you begin to diversify the composition of your assets, choosing among types of loans with varying levels of risk and return. You can also grow your assets further by adding debt with alternative sources of liabilities, including deposits and borrowed funds. Note that different assets and liabilities have different returns and default rates based on the state of the world Action Items for Round 2 Part A: 1. Revisit the asset allocation and funding source decisions you made in Round 1 in light of the outcomes (1 through 7) provided by your instructor: utcomes Outcome Probability ash No Change No Change No Change .36% No Change 0.06% No Change No Change No Change No Change No Change .5096 No Change .7596 ne-Year U.S. Treasury Bills ive-Year U.S. Treasury Notes o Change 88% 58% 15-Year U.S. Treasury Bonds Notes 16.67% o Change 25 25 13.89 13.89 78% 58% 5896 68% 86% 1. 5696 1.86% 1.46% 75% 50% 78 78 Outcome 1: No Change Outcome 2: Upward shift by 20 basis points (bp) in all securities . Outcome 3: Downward shift by 10 bp in all securities . Outcome 4: Upward increase in the slope of the Treasury yield curve Outcome 5: Decrease in the slope of the Treasury yield curve Outcome 6: Flattening of the Treasury yield curve Outcome 7: Inversion of the Treasury yield curve Based on the actual outcome at the end of t1 and assuming all notes and bonds initially traded at par, that is, the t 0 annual rate is the coupon rate, complete the following table ound One Allocation in $ (a) nnual Rates of Return t-0 (b) utcome Rates t 1 Interest Income t 1 (d) sset Valuation t-1 (e) c) ash ne-Year U.S. T-Bills 16% a x b a x b a x b ive-Year U.S. T-Notes 68%0 Below 15-Year U.S. T- Bonds 1.66% Below otal 1,000,000 Assuming coupon payments occur once each year, the values for the initial five-year T-Notes and 15-year T-Bonds at t1 are calculated as follows Balance Sheet t-1: End of Round 1 Assets et Securities iabilities and Shareholders' Equity otal Liabilities Common Stock $1,000,000 etained Earnings Total Shareholders' Equity otal Assets otal Liabilities and Shareholders' Equity Of course, make sure Total Assets Total Liabilities and Shareholders' Equity 2. In a paragraph, discuss what caused the above changes to your bank's balance sheet Part B: 1. In Round 2 you are asked to grow your bank's balance sheet through the expansion of assets funded by liabilities. Specifically, you can now leverage (increase the liabilities of) your bank up to a multiple of 12x total shareholder's equity. Using Balance Sheet sources of funds. Here are your new alternatives for Round 2: 1: Start of Round 2 make decisions regarding your Round 2 asset allocations and Below are the possible return and cost outcomes in period 2 and their probabilities: comes tcome Probability 16.67% 5% 5%% 13 . 89% 13.89% 78% 78% curities (T-bills) 25% et 6% et 2% et 3% 25% et 7% Net 3% et 4% 25% et 5% et1% et 2% 25% et 8% et 4% et 5% 25% 25% et 8% et 4% et 5% 25% et 2% Net 096 nsumer Loans et 4% sidential Mortgages Net 0.5% I Loans Net 1% et 0,5% eposits rrowed Funds 1% 196 190 1% 50% 396 Outcome 1: No Change Outcome 2: Moderate economic expansion: slightly fewer loan losses than estimated . Outcome 3: Moderate economic decline: slightly higher loan losses than estimated . Outcome 4: Strong economic expansion: even fewer loan losses than estimated . Outcome 5: Strong economic decline: even higher loan losses than estimated .Outcome 6: Asset Bubble: fewer loan losses and a drop in the cost of Borrowed Funds Outcome 7: Liquidity Crisis: even higher loan losses and an increase in the cost of borrowed funds alance Sheet t= 2: Start of Round 2 Liabilities and Shareholders Equity Securities (T-Bills) onsumer Loans Residential Mortgages C&I Loans otal Shareholders' Equity otal Assets *Loan figures are net of loan loss provisions Again, make sure Total Assets Total Liabilities and Shareholders' Equity Borrowed Funds Total Liabilities Common Stock Retained Earnings otal Liabilities and Shareholders' Equity