

Answered step by step
Verified Expert Solution
Question
1 Approved Answer
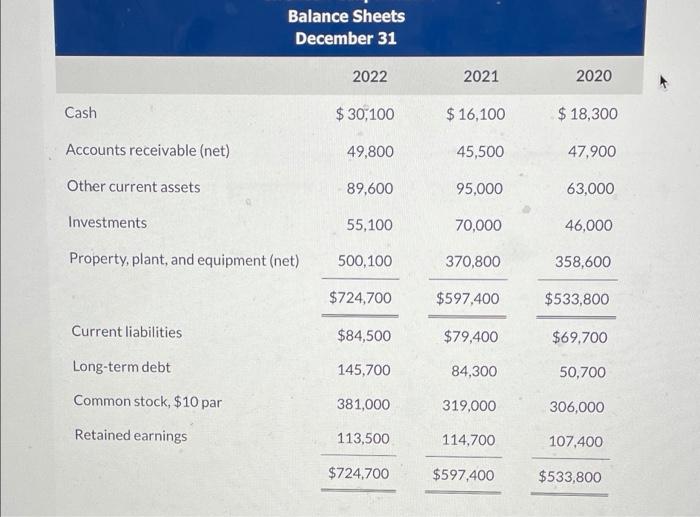
Balance Sheets December 31 2022 2021 2020 Cash $30,100 $ 16,100 $ 18,300 Accounts receivable (net) 49,800 45,500 47.900 Other current assets 89,600 95,000 63,000
Step by Step Solution
There are 3 Steps involved in it
Step: 1

Get Instant Access to Expert-Tailored Solutions
See step-by-step solutions with expert insights and AI powered tools for academic success
Step: 2

Step: 3
Ace Your Homework with AI
Get the answers you need in no time with our AI-driven, step-by-step assistance
Get Started
Cost Analysis And Estimating Tools And Techniques
Authors: Willis R. Jr. Greer, Daniel A. Nussbaum
1990th Edition
0387973257, 978-0387973258