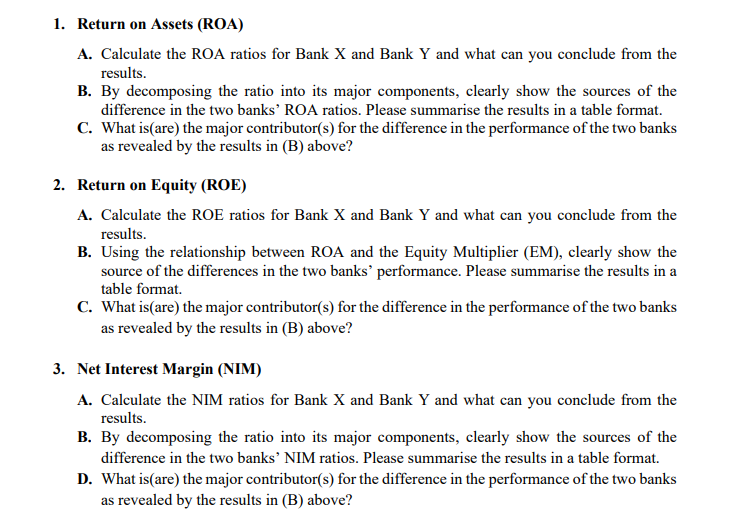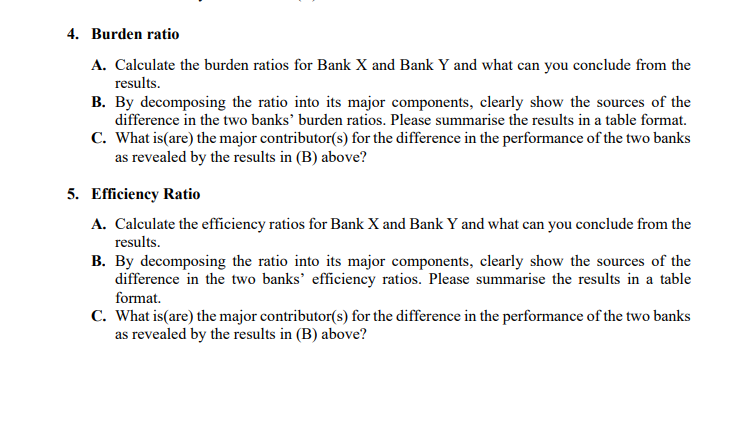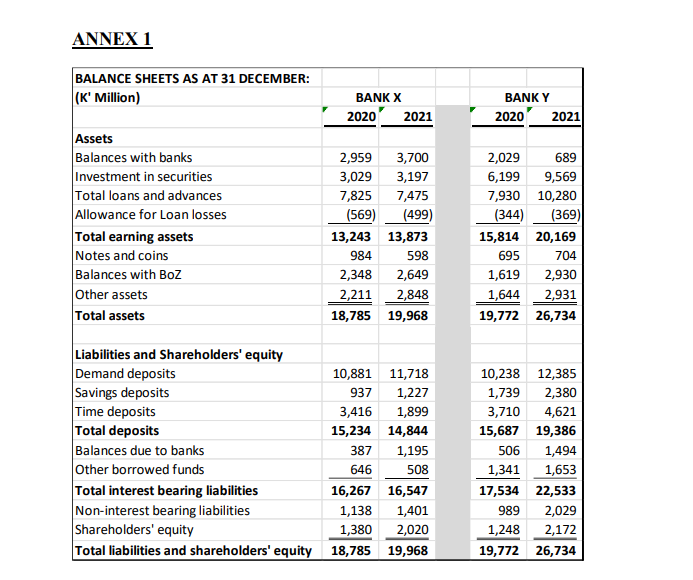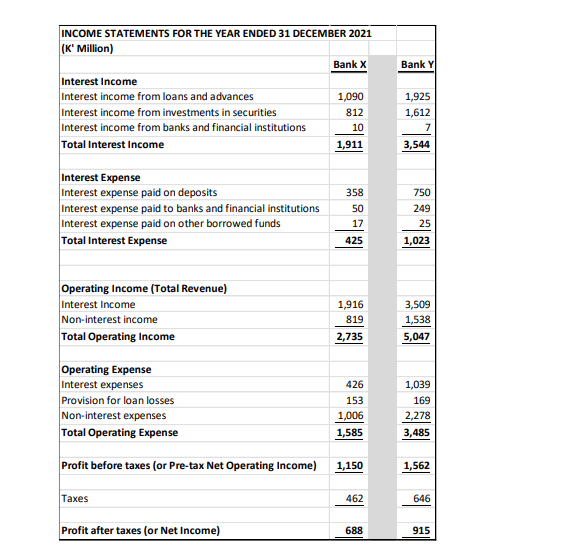


Bank X and Bank Y are two of the top 5 banks operating in Zambia. As at 31 December 2021, Bank X accounted for 13% and Bank Y accounted for 17\%, of the Zambian banking sector's total assets and deposits, respectively. The two banks are typical commercial banks involved in both retail and wholesale business and have similar number of branches and ATMs located across the country. REOUIRED: Use the financial statements of Bank X and Bank Y contained in Annex 1 to answer the questions. Each question 1 to 5 carries 20 marks, distributed as follows: A (10 marks); B (5 marks) and C (5 Notes: - To prepare for this assignment, please go through the material covered under Unit 5. - For all balance sheet items, please use average amounts when performing the ratio analysis (e.g., average assets for (2021)=[ Total assets (2021) + Total assets (2020) ] divided by 2 ). - Calculate your numerical answers to two decimal places. - Assignment to be submitted through Moodle. 1. Return on Assets (ROA) A. Calculate the ROA ratios for Bank X and Bank Y and what can you conclude from the results. B. By decomposing the ratio into its major components, clearly show the sources of the difference in the two banks' ROA ratios. Please summarise the results in a table format. C. What is(are) the major contributor(s) for the difference in the performance of the two banks as revealed by the results in (B) above? 2. Return on Equity (ROE) A. Calculate the ROE ratios for Bank X and Bank Y and what can you conclude from the results. B. Using the relationship between ROA and the Equity Multiplier (EM), clearly show the source of the differences in the two banks' performance. Please summarise the results in a table format. C. What is(are) the major contributor(s) for the difference in the performance of the two banks as revealed by the results in (B) above? 3. Net Interest Margin (NIM) A. Calculate the NIM ratios for Bank X and Bank Y and what can you conclude from the results. B. By decomposing the ratio into its major components, clearly show the sources of the difference in the two banks' NIM ratios. Please summarise the results in a table format. D. What is(are) the major contributor(s) for the difference in the performance of the two banks as revealed by the results in (B) above? 4. Burden ratio A. Calculate the burden ratios for Bank X and Bank Y and what can you conclude from the results. B. By decomposing the ratio into its major components, clearly show the sources of the difference in the two banks' burden ratios. Please summarise the results in a table format. C. What is(are) the major contributor(s) for the difference in the performance of the two banks as revealed by the results in (B) above? 5. Efficiency Ratio A. Calculate the efficiency ratios for Bank X and Bank Y and what can you conclude from the results. B. By decomposing the ratio into its major components, clearly show the sources of the difference in the two banks' efficiency ratios. Please summarise the results in a table format. C. What is(are) the major contributor(s) for the difference in the performance of the two banks as revealed by the results in (B) above? ANNEX 1 Bank X and Bank Y are two of the top 5 banks operating in Zambia. As at 31 December 2021, Bank X accounted for 13% and Bank Y accounted for 17\%, of the Zambian banking sector's total assets and deposits, respectively. The two banks are typical commercial banks involved in both retail and wholesale business and have similar number of branches and ATMs located across the country. REOUIRED: Use the financial statements of Bank X and Bank Y contained in Annex 1 to answer the questions. Each question 1 to 5 carries 20 marks, distributed as follows: A (10 marks); B (5 marks) and C (5 Notes: - To prepare for this assignment, please go through the material covered under Unit 5. - For all balance sheet items, please use average amounts when performing the ratio analysis (e.g., average assets for (2021)=[ Total assets (2021) + Total assets (2020) ] divided by 2 ). - Calculate your numerical answers to two decimal places. - Assignment to be submitted through Moodle. 1. Return on Assets (ROA) A. Calculate the ROA ratios for Bank X and Bank Y and what can you conclude from the results. B. By decomposing the ratio into its major components, clearly show the sources of the difference in the two banks' ROA ratios. Please summarise the results in a table format. C. What is(are) the major contributor(s) for the difference in the performance of the two banks as revealed by the results in (B) above? 2. Return on Equity (ROE) A. Calculate the ROE ratios for Bank X and Bank Y and what can you conclude from the results. B. Using the relationship between ROA and the Equity Multiplier (EM), clearly show the source of the differences in the two banks' performance. Please summarise the results in a table format. C. What is(are) the major contributor(s) for the difference in the performance of the two banks as revealed by the results in (B) above? 3. Net Interest Margin (NIM) A. Calculate the NIM ratios for Bank X and Bank Y and what can you conclude from the results. B. By decomposing the ratio into its major components, clearly show the sources of the difference in the two banks' NIM ratios. Please summarise the results in a table format. D. What is(are) the major contributor(s) for the difference in the performance of the two banks as revealed by the results in (B) above? 4. Burden ratio A. Calculate the burden ratios for Bank X and Bank Y and what can you conclude from the results. B. By decomposing the ratio into its major components, clearly show the sources of the difference in the two banks' burden ratios. Please summarise the results in a table format. C. What is(are) the major contributor(s) for the difference in the performance of the two banks as revealed by the results in (B) above? 5. Efficiency Ratio A. Calculate the efficiency ratios for Bank X and Bank Y and what can you conclude from the results. B. By decomposing the ratio into its major components, clearly show the sources of the difference in the two banks' efficiency ratios. Please summarise the results in a table format. C. What is(are) the major contributor(s) for the difference in the performance of the two banks as revealed by the results in (B) above? ANNEX 1


