

Question
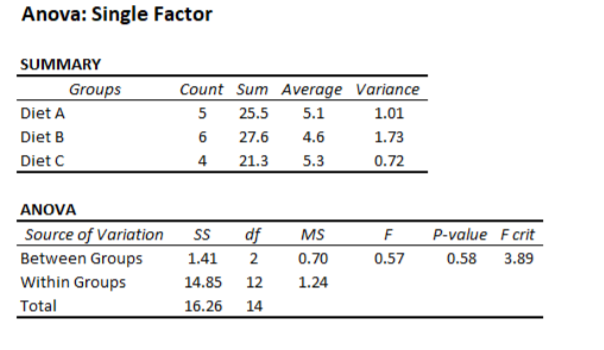
Base on the graph, indicate if at least one of the means (monthly weight loss in kg for three diets) was statistically different than the
Base on the graph, indicate if at least one of the means (monthly weight loss in kg for three diets) was statistically different than the others or not, pointing out the number(s) from the table you based your conclusion on and your own desired level of significance (?)
Step by Step Solution
There are 3 Steps involved in it
Step: 1

Get Instant Access to Expert-Tailored Solutions
See step-by-step solutions with expert insights and AI powered tools for academic success
Step: 2

Step: 3
Ace Your Homework with AI
Get the answers you need in no time with our AI-driven, step-by-step assistance
Get Started
Precalculus
Authors: Michael Sullivan
10th Global Edition
1292121772, 1292121777, 978-1292121772