Question: Based on Chapter 3 Operational Finance, describe how ratio analysis can be useful to operations management e system: Teaching Medicine, 329(14) mpetitive business CT: Greenwood
Based on Chapter 3 "Operational Finance", describe how ratio analysis can be useful to operations management
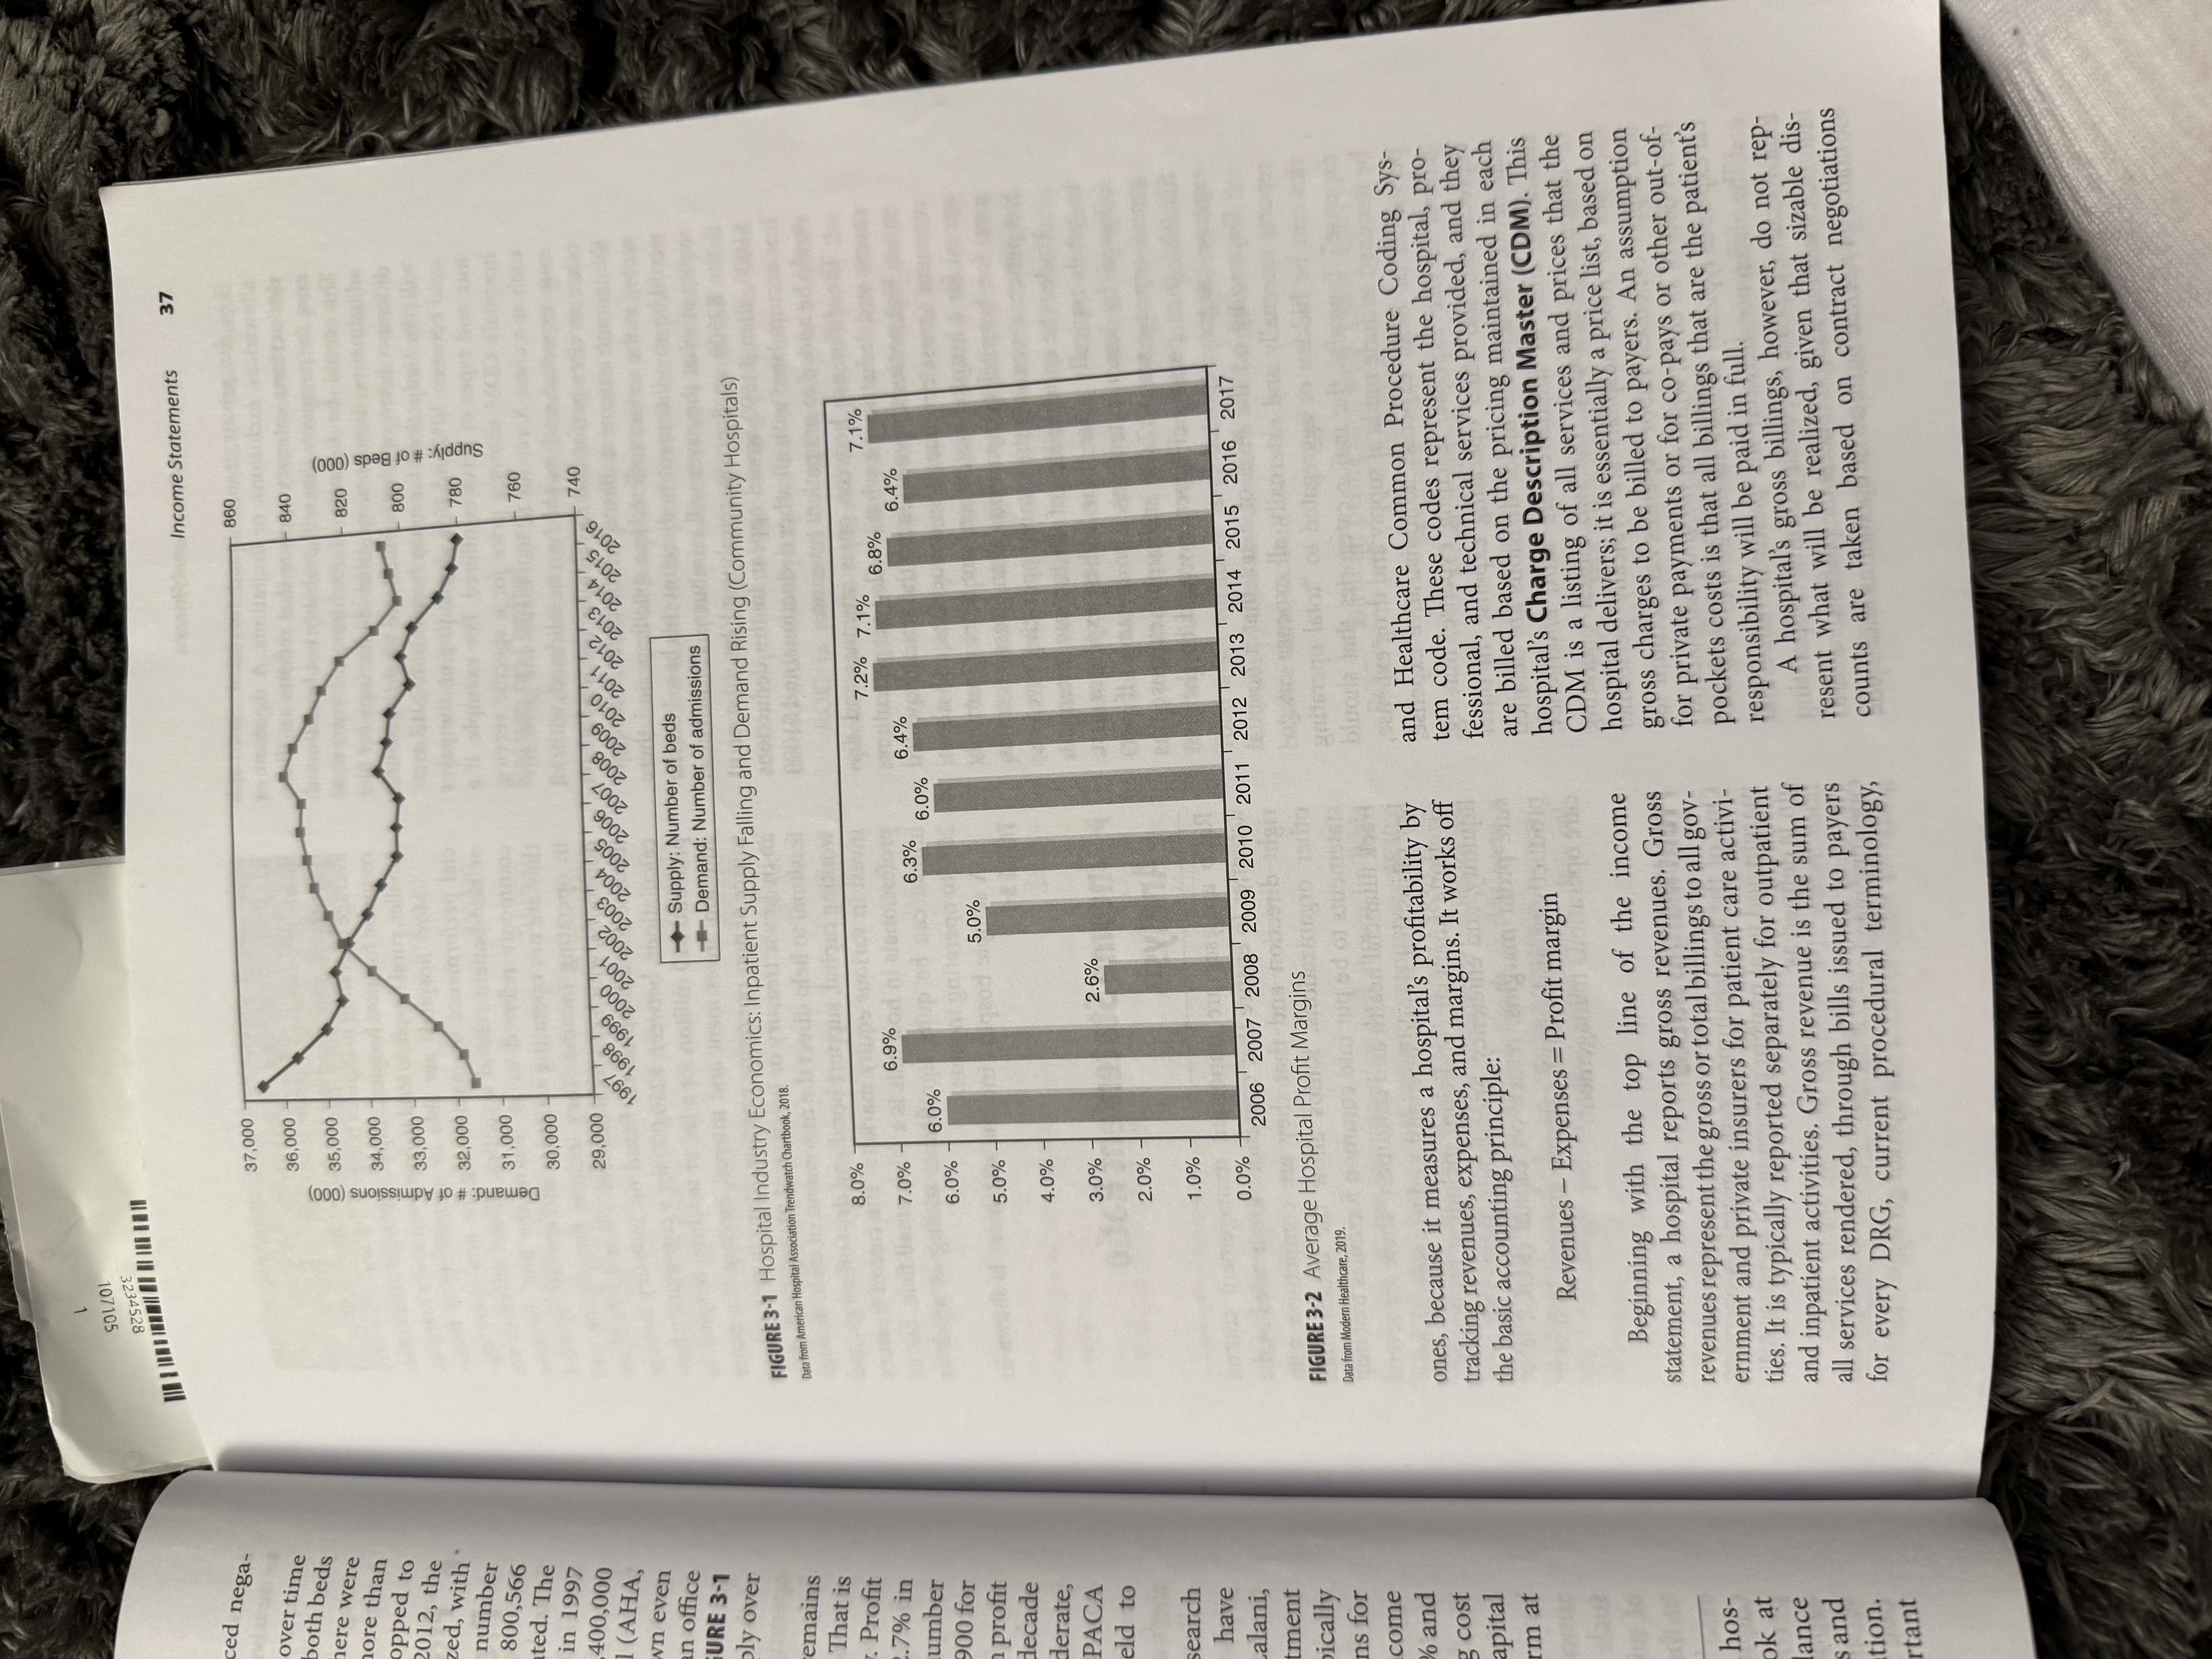
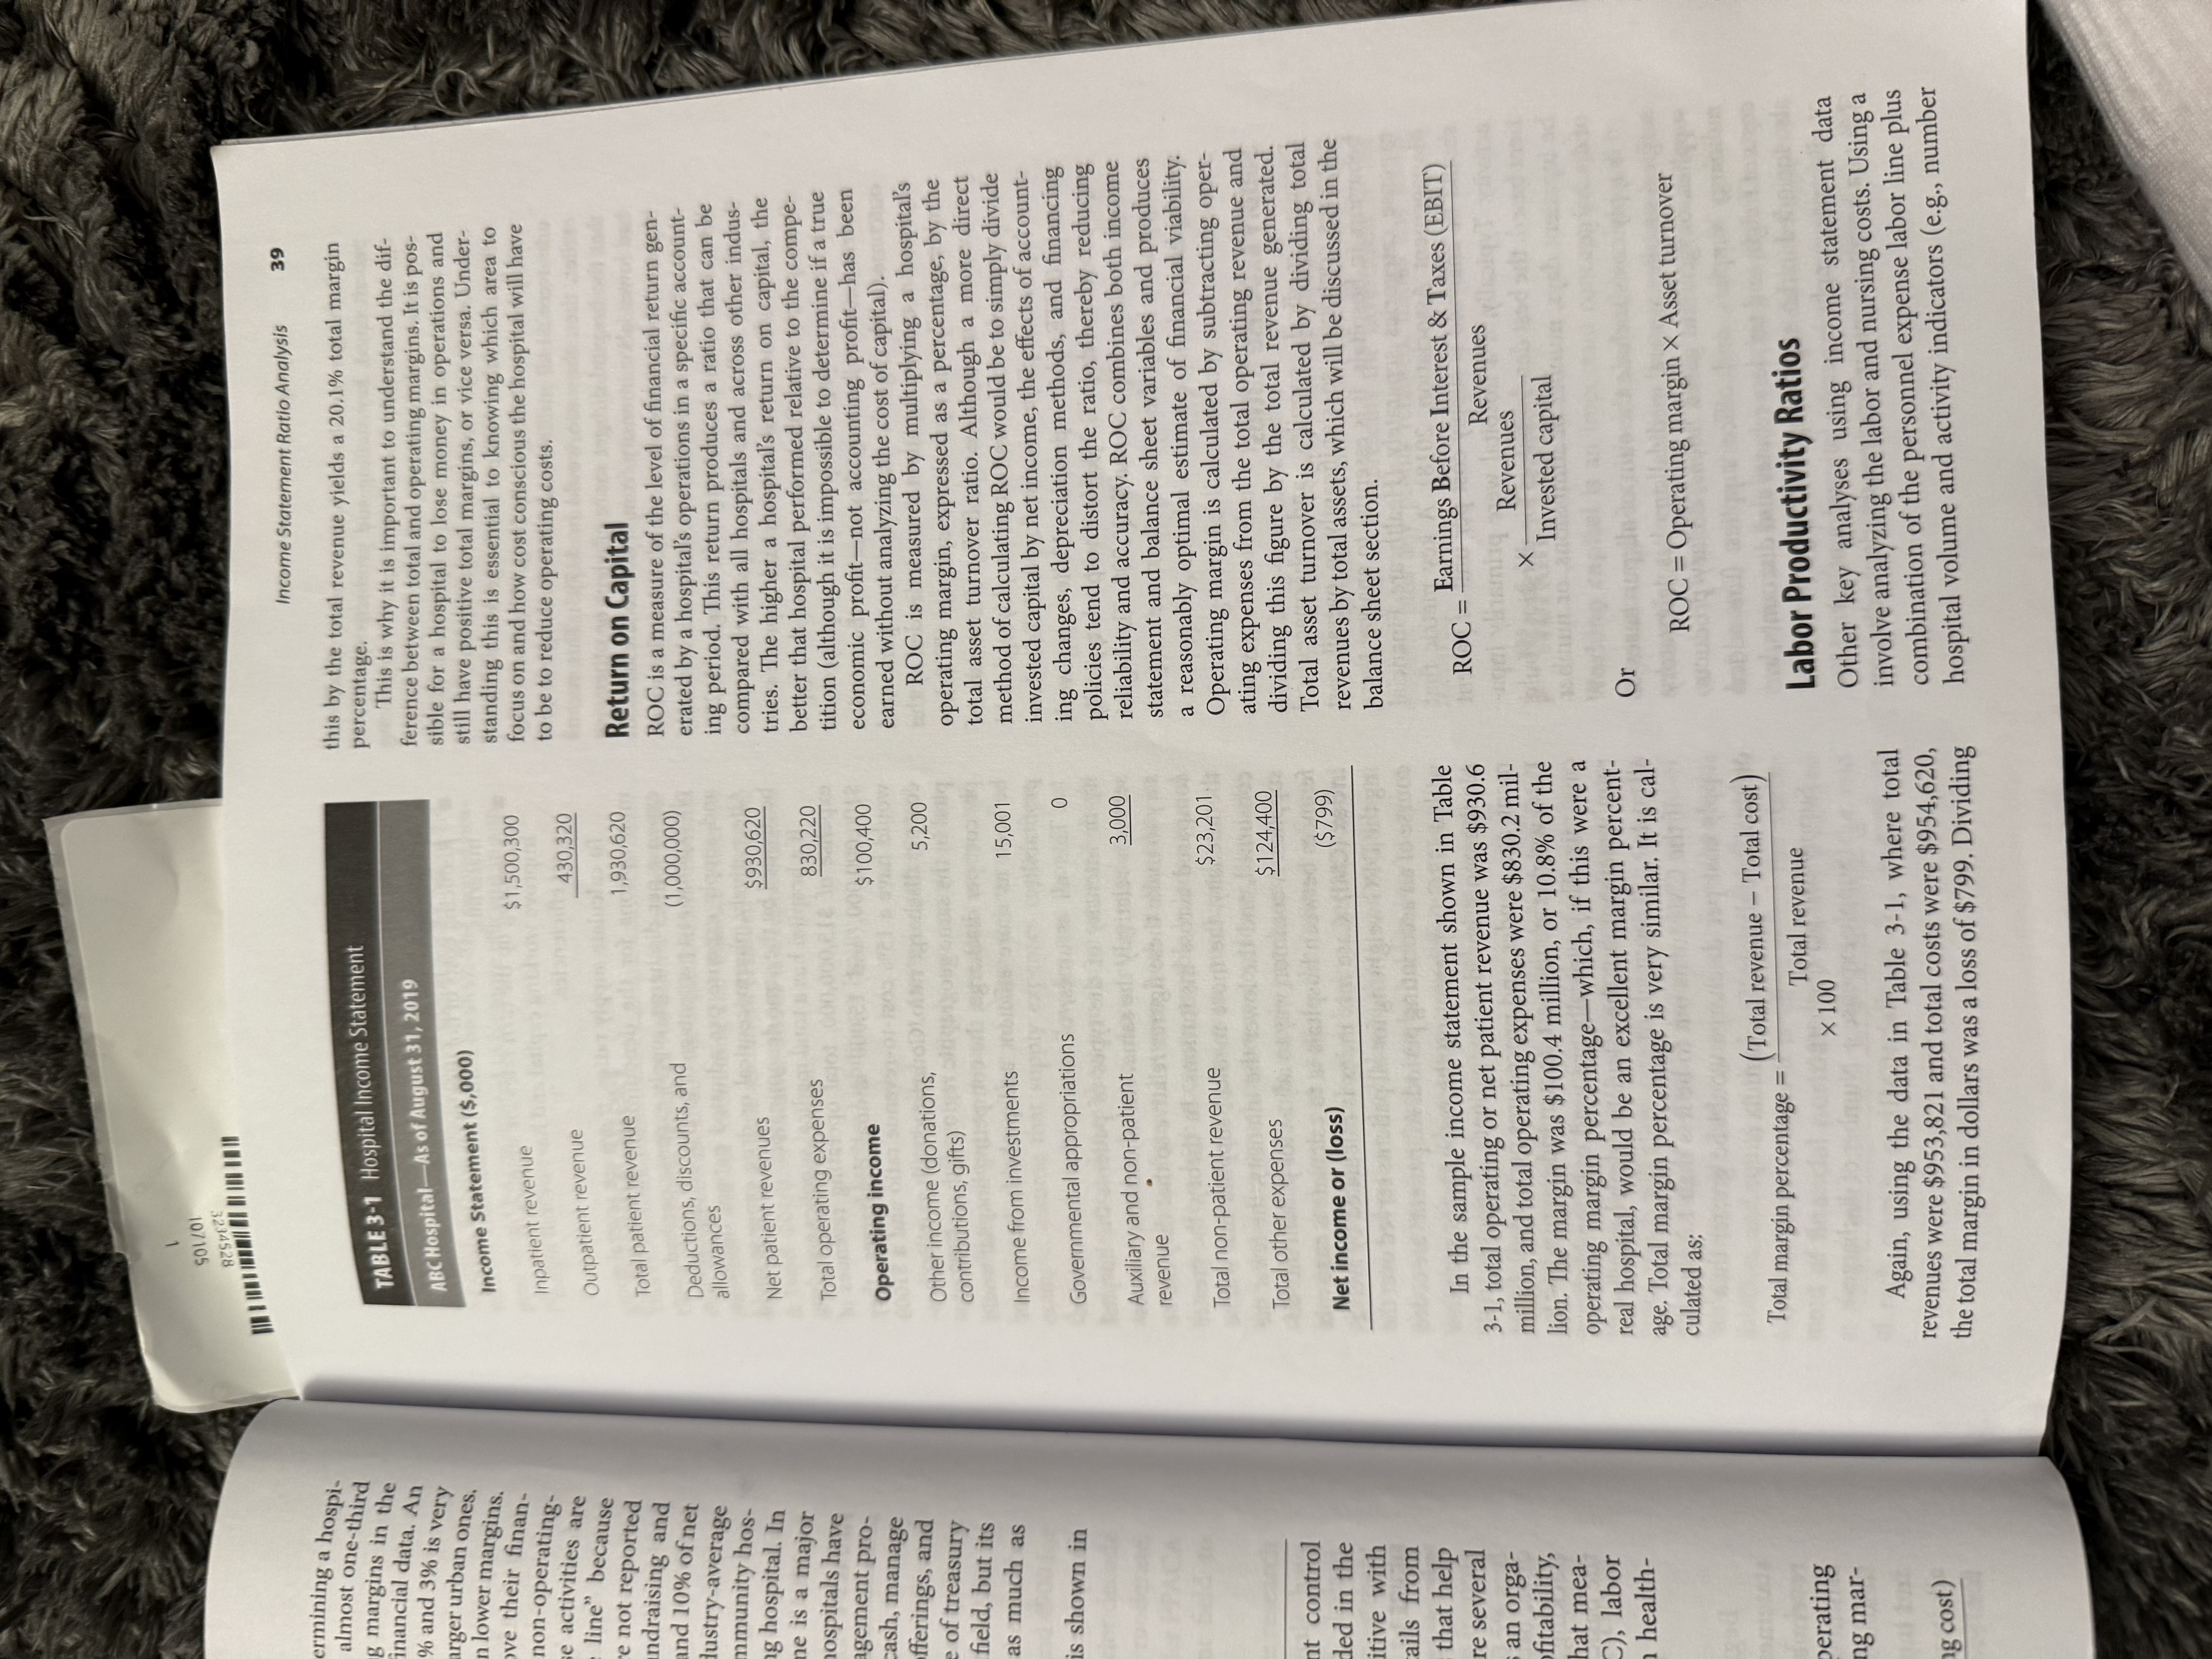
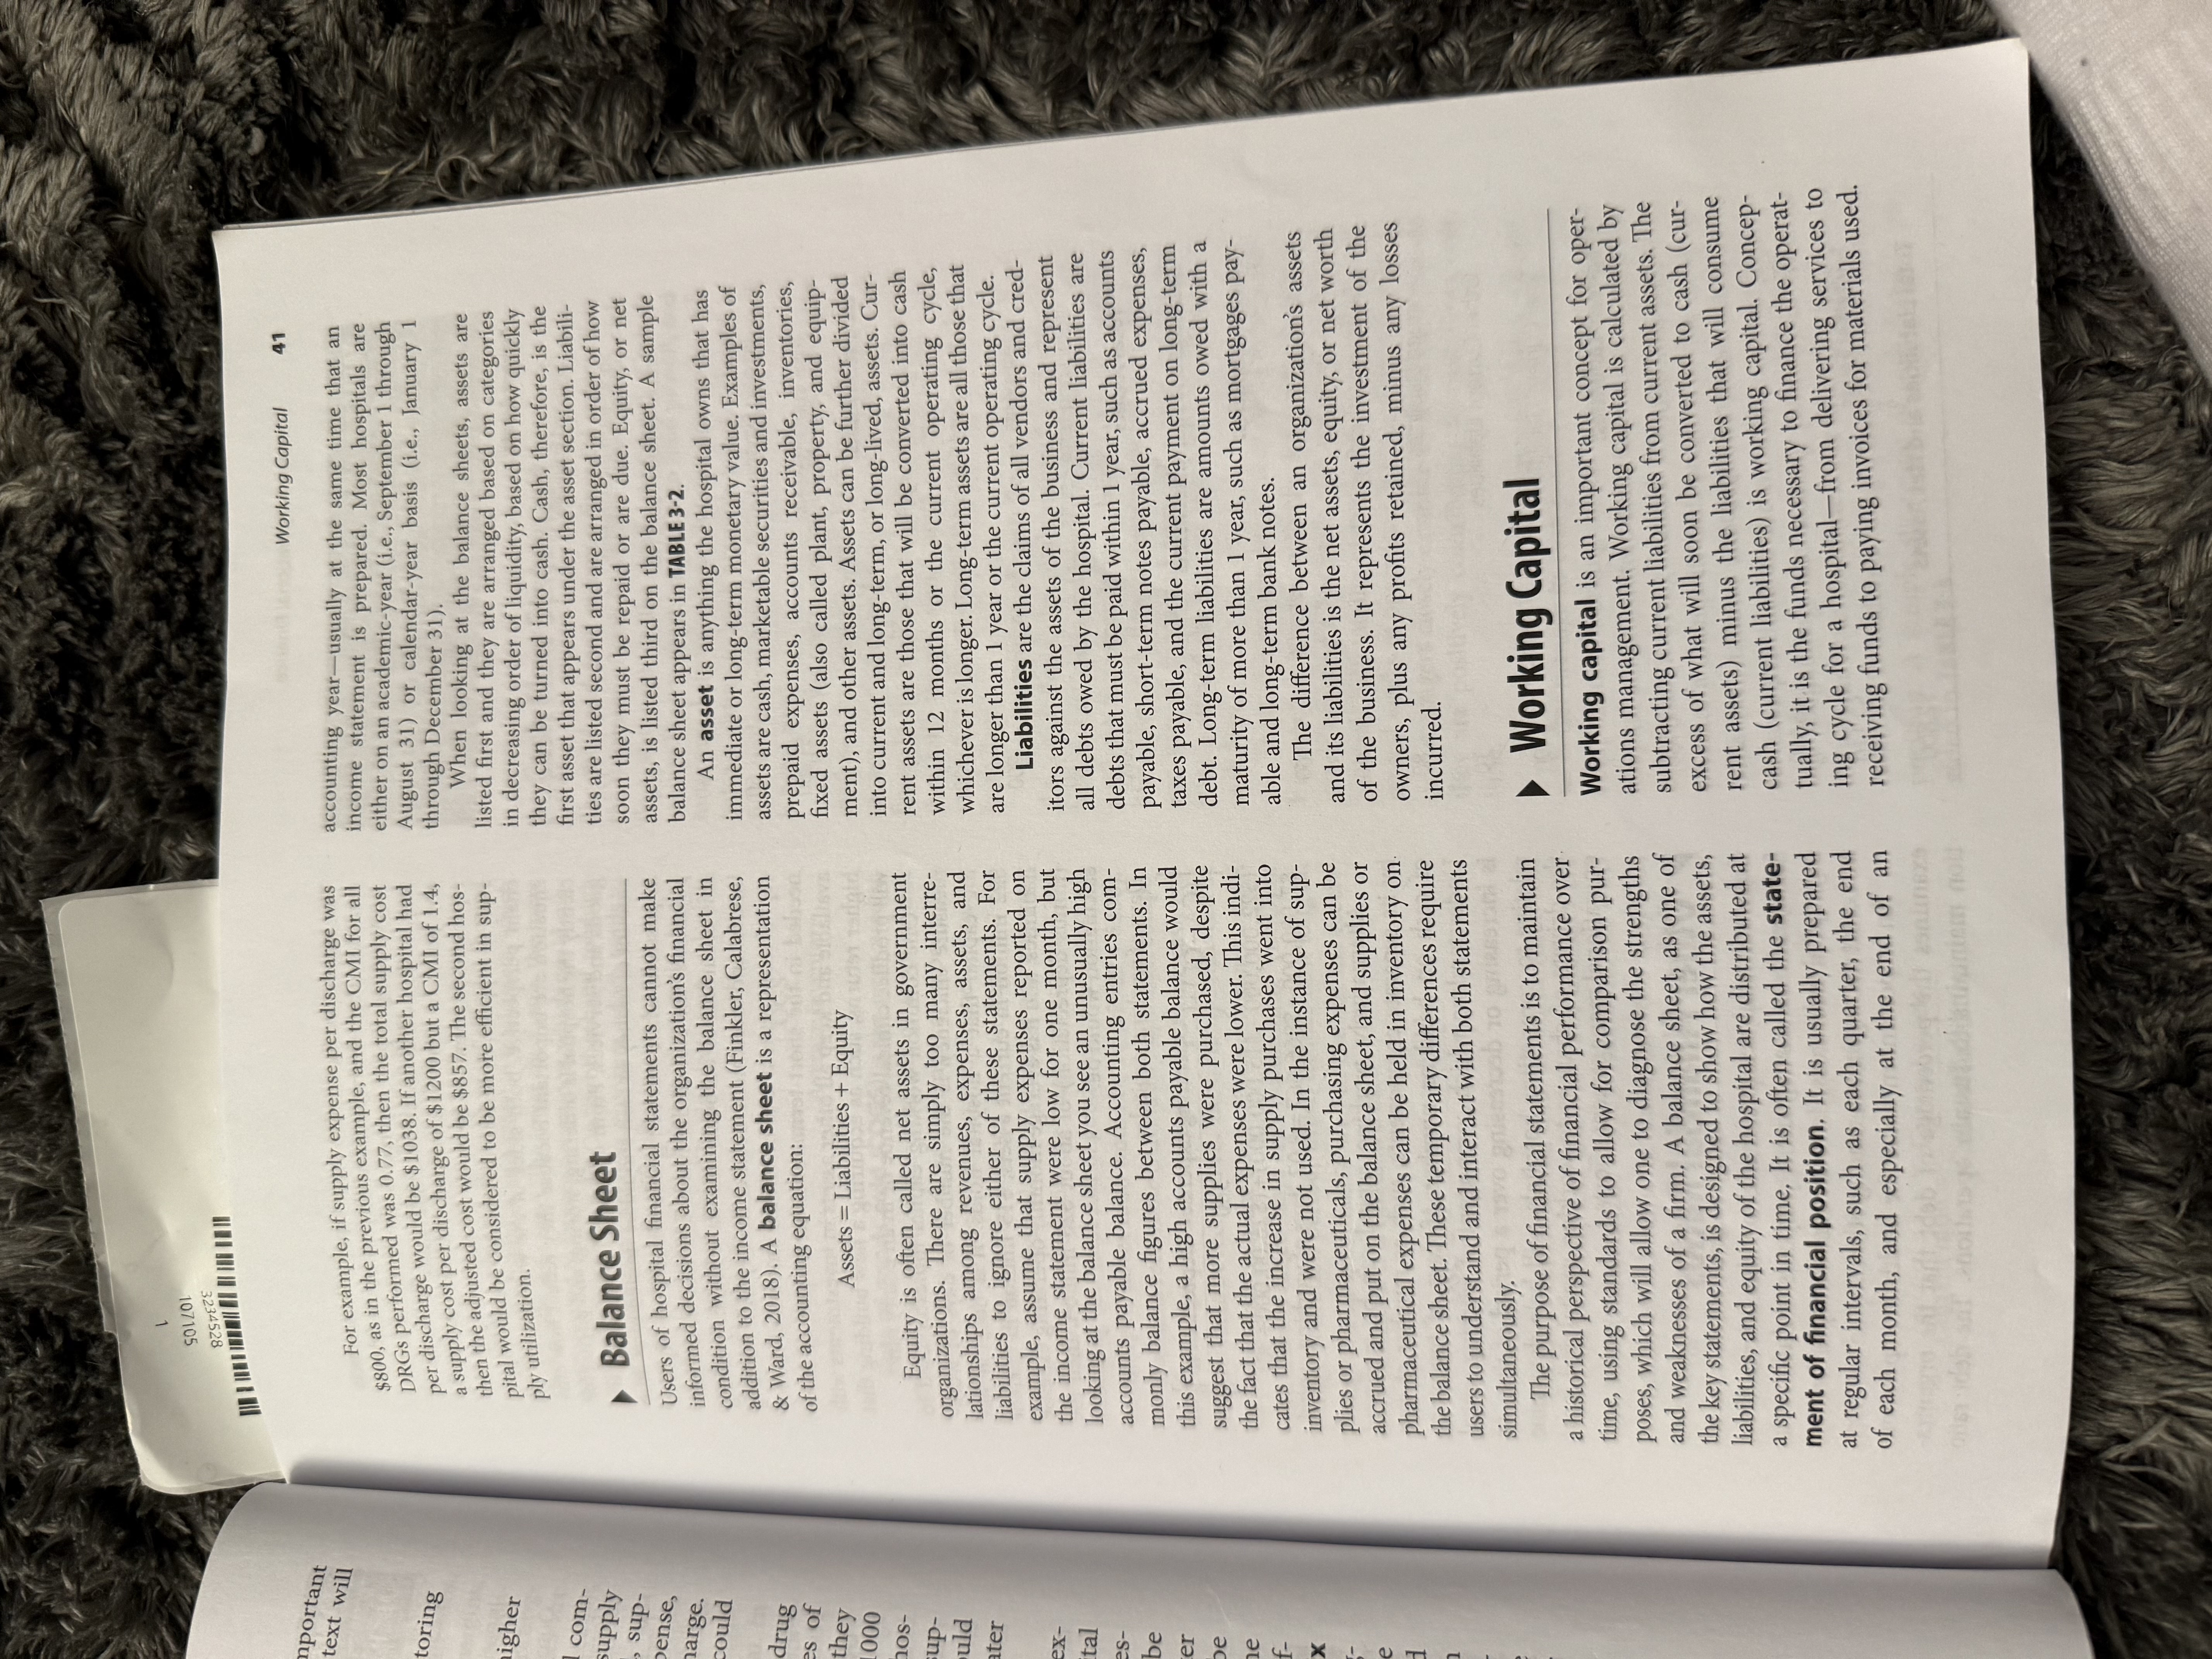
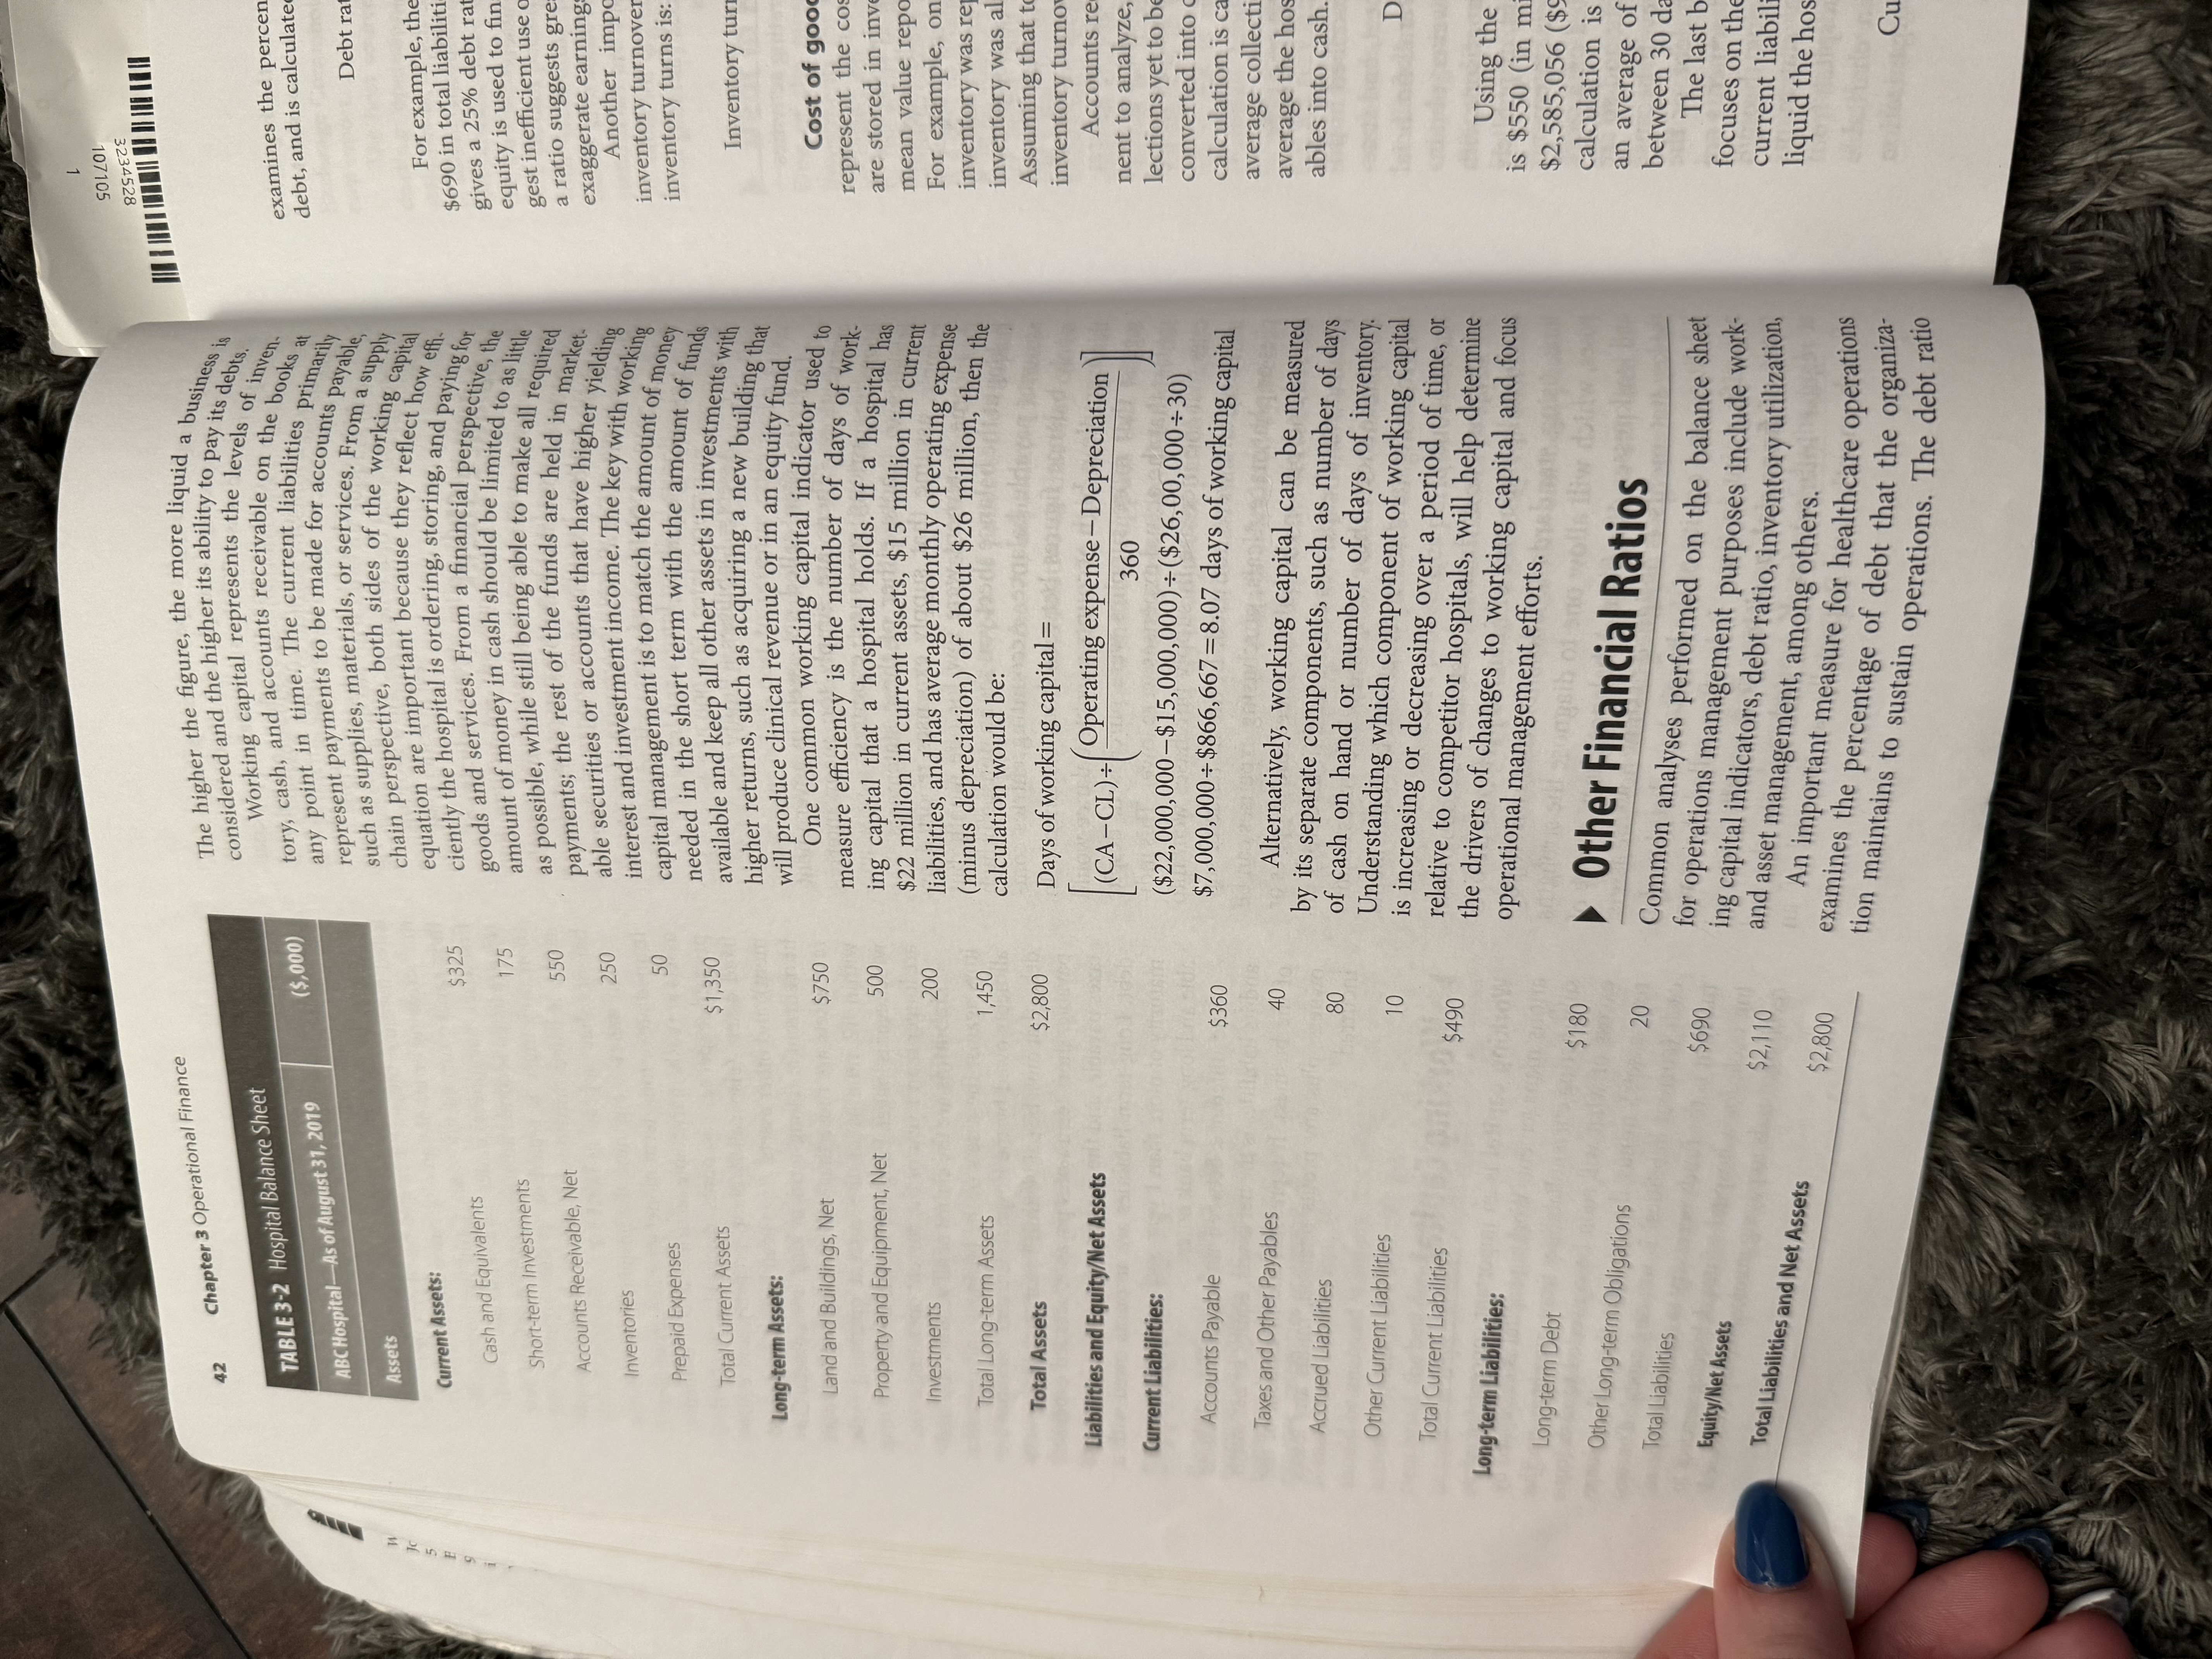
e system: Teaching Medicine, 329(14) mpetitive business CT: Greenwood 10 ad how they work. O Design Credits : @ maxkabakov /Getty Images; @ amgun/Getty Images; @ monsity/Getty Images. CHAPTER 3 Operational Finance GOALS OF THIS CHAPTER 1. Discuss the concept of a hospital as a business and the need for financial management of healthcare businesses. 2. Define how healthcare organizations are paid for services. 3. Understand the varying types of reimbursement to hospitals and the operational challenges of these methods of payment. 4. Describe the three primary financial statements and what they measure. 5. Define working capital and discuss how operations management influences it. 6. Identify sources of financial data for use in operational analyses. T The healthcare industry today is second only to extent that the decision to remain open generates pos- national defense in its share of the U.S. econ- itive cash flow. Decisions about hours in health care omy, totaling 17.2% of gross domestic product are driven largely by societal needs and expectations as of 2017, with estimates going as high as 19.6% by for round-the-clock medical service and availability 2021. The rapid growth of healthcare costs-for which of care at all times. This is especially true for hospitals hospitals account for nearly 33%-is an area of great that operate as a nonprofit entity where community concern for government leaders and appears to be needs may be expected to supersede decisions about leading to the potential for future constraints on pay- positive cash flow. ments to hospitals. Considering some of the unique Nonetheless, hospitals have to manage the same characteristics of the hospital organization, limits in set of business resources as any other type of orga- payment growth, or even outright reductions in pay- nization, whether talking about financial resources, ments, pose a significant challenge for the operations personnel, equipment, supplies, technology, facilities, manager in today's healthcare organization. etc. Hospitals employ hundreds or even thousands of Healthcare facilities, and hospitals in particular, people, with payrolls that can reach several hundred usually work on a 24-hour-per-day basis in order to million dollars. They serve as a marketplace and are maintain availability of services when needed by per- suppliers of valuable services to hundreds of customers sons who are suddenly ill or injured. This constant daily. They are buyers, procuring a vast array of sup- operating schedule creates labor and scheduling inef- plies, pharmaceuticals, and technology. To function ficiencies, since it is entirely possible that hospital efficiently, hospitals have to manage people, money, resources may be available yet not used if no illness time, and business processes. They are economic or injury happens at any given time, Some industrial engines that generate significant cash flows while pro- organizations do this as well, but they do so only to the viding healthcare services to the community. In short,Chapter 3 Operational Finance 34 state) and states pick up the remainder. The federal hospitals are a business. Managing these financial portion of the funding formula is inversely related to affairs requires an understanding of the financial envi- per capita state income, where wealthier states pay a ronment of hospitals and the financial tools used to larger proportion of their Medicaid costs while states with lower per capita incomes pay a smaller share of manage these organizations. the costs of their Medicaid programs. States are other- wise able to control their own policies, so reimburse- How Hospitals Are Paid ment for services (and what services are reimbursed) vary from state to state. Providers of healthcare services (and hospitals, in par- Nongovernmental payers are referred to as com- ticular) are in many ways unique in the U.S. economy mercial insurers and collectively fund between 30% in that they routinely provide services for which they and 40% of the nation's hospital services. The major- incur costs at the time of service, but are not paid for ity of these commercial insurance plans are made those services for a period of weeks or months there- available to people as a benefit provided as a part of after. Since providers pay the costs of rendering care at or before the time of service, payments to the provider employment in the United States. Because commer- are usually termed reimbursements. The gap in time cial insurers represent the interests of many employ- between the provision of services and reimbursement ers in the economy, they exert significant influence in for those services is a result of the organization of our the healthcare market place; aggressively negotiating healthcare system where a third-party insurer (usually discounted fees for services in exchange for patient referred to as the payer) pays for services on behalf of referrals. In addition, commercial insurers have the patient. While the patient may have some nominal adopted policies to control the level of patient access amount to pay for hospital services, the vast majority to services in the extent to which certain services are of payments for hospital services come from third- even reimbursed to providers. Some such insurers are party payers. in fact organized primarily around the management Payers for hospital services are generally classi- of healthcare access and cost and are referred to as fied as government or nongovernment insurers. There managed care companies. are two major governmental insurers that together Each of these different types of payers has a cer- fund the majority of hospital services: Medicare and tain degree of leverage, based on the size of their Medicaid. Medicare is the federal government health network, the number of enrollees or members in the insurance plan that offers care to more than 44 million plan, and the number and type of patients they cover. patients who are elderly, disabled, or with end-stage renal disease. Medicare has three primary compo- Therefore, each payer has varying level of ability to nents: Parts A, B, and D. Part A provides inpatient influence and establish hospital reimbursements. The hospital coverage for participants, as well as some same services and supplies provided to two different post-hospital treatment and hospice care. Part A is patients may have the same prices billed on the hospi- paid for by a required payroll tax deduction from the tal invoice for both patients, but the ability for a hos- entire American population. Part B is a supplemental pital to collect the entire amount is entirely based on insurance program that requires monthly premium the individual payer that is reimbursing the hospital. contributions by the participant and covers physician One payer might cover 60% of all costs billed, while services, emergency room services, and outpatient another might reimburse the entire amount. Negotia- visits. Part D is Medicare's prescription drug benefit tions, settlements, and pre-established reimbursement program, which offers discounts on outpatient drugs programs for all payers govern the extent to which to lower-income seniors and disabled individuals. costs will be reimbursed. Medicare Part A funds the largest portion of hospital reimbursements of the three parts. In general, Medicaid is considered to be the payer The federal government also funds and oversees that reimburses the lowest for all services-in most Medicaid, Medicaid is designed to meet the health- cases not even fully reimbursing providers for the total care needs of certain individuals with low incomes or cost to deliver care. Other payers might reimburse at disability who otherwise might not have the ability to cost for specific services that might be specialized or pay for care, General tax revenues from both federal hard to find but reimburse significantly less for ser- and state governments finance this insurance pro- vices that are very competitive and general. Also, gram, where the federal government funds the major- despite passage of the Patient Protection and Afford- ity of costs (between 50% and 83%, depending on the able Care Act of 2010 (PPACA), in excess of 10% of the U.S. population remains uninsured. Such individuals often pay very little if any of the costs of their care and107105 234528 From Retrospective to Prospective 35 e federal elated to received only the minimal amount of care necessary incentive on the part of the provider to limit the es pay a to treat an emergency condition under Federal law. To amount of services provided to the patient. le states the extent that a hospital has a mission of serving the . Per diem is a fixed daily payment to cover all ser- share of poor and uninsured, the demand for strong financial vices and procedures performed. It is essentially a daily e other- management to support operations management can rate that limit the exposure for a payer but provide burse- determine if a hospital can stay in business. revenue caps for the hospital. It is effective in some pursed) cases, but much like FFS payment, per diem creates an From Retrospective to incentive for a hospital to treat patients longer, gener- com- ating higher average lengths of stay, in order to maxi- mize revenue. n 30% Prospective Closely related to the per diem method is the major- case rate, which is a prospectively determined made Since the introduction of the prospective payment sys- art of tem (PPS) by Medicare in 1983, there have been con- amount that is paid for all services associated with mer- tinued financial pressures placed on hospitals. Prior a hospital admission, regardless of the costs for that occasion of care. Case rates are often used for spe- ploy- to this legislation, Medicare paid hospitals on a retro- spective or cost-plus reimbursement system. In this cific types of services such as childbirth or organ ice in context, retrospective literally means to look back- transplants. A closely related payment method in use ating ward at all costs incurred. This means that regardless today-upon which the original PPS was formed- tient of the total cost to deliver services, including both is the use of diagnosis-related groups to adjust case have rate payments to reflect the expected resource needs cess operational and capital components, insurers would fully compensate actual costs, plus a component to of a particular patient's condition. The diagnosis- are represent a small profit margin. In an era where rev- related group (DRG) is a classification scheme, pri- are enue was unconstrained, there was no need for cost marily used for inpatient treatment that categorizes ent efficiencies or fiscal discipline in spending or utilize- all patients through principal and secondary diag- as tion patterns. Fee-for-service (FFS) was the original nosis, procedures provided, age, sex, and other fac- reimbursement method used by commercial insur- tors. Although DRGs are the basis for payment under er- ers, where hospitals are paid directly for every service Medicare, they are also used by a number of com- performed-essentially a "piece rate" system. Later mercial insurers and payers because of their compre- iterations of this payment methodology called for dis- hensive classification schema. counts off of provider routine fees. FFS payment cre- Under the DRG system, hospital rates are set ates an incentive for healthcare providers to increase based on the patient's illness and the length of time the number of services provided in order to increase required to treat that illness in an inpatient setting collected fees. Rapid increases in payments to hos- Many private insurers prefer fixed per diem for inpa- pitals in the late 1960s and throughout the 1970s tients, where a fixed daily "allowance" is provided precipitated a call for changes away from both the ret- for all services performed and supplies consumed. rospective and FFS methods of payment to hospitals, Private insurers tend to use negotiating and contract resulting in PPS only a few years later. management processes to establish pricing; they use Prospective payment represents a methodol- contracts where negotiated discount provisions are ogy in which fee schedules are calculated based on based on market coverage, type of service, and volume treatment type or illness classification and are paid of activity. In general, the use of a standard fixed rate in advance of the treatment without regard to actual reimbursement for each type of service performed, costs incurred, Since implementation of PPS, hospitals adjusted for case complexity, is the standard for most have endured a variety of reimbursement practices, all hospitals. aimed at reducing costs and improving efficiency, One The per diem, case rate, and DRG mechanisms such practice is capitation, Capitation is a method all relate to reimbursement for inpatient hospi- of reimbursement that transfers financial risk of care tal services. Similar approaches apply to outpatient to the provider and away from health plans or insur- and ambulatory facilities where fixed, prospect ers, by limiting payments to a fixed-dollar amount, tive amounts are paid for outpatient services, such Capitation reimburses the provider on a per-member as diagnostic testing, emergency room visits, and per-month basis, such that a flat payment is made per ambulatory surgery procedures. These services are capita to a defined population for a specified menu of usually reimbursed on a flat per procedure rate that services, over a specific period of time, While capita- varies by the type of service, similar to the case rate tion is very favorable to the payer, it creates a strong mechanism used for inpatient care. Similar to theChapter 3 Operational Finance one-third (34.6%) of all hospitals experienced nega- 36 tive profit margins (CMS, 2018b) DRG mechanism, outpatient per procedure fees may That is exactly what continues to happen over time be adjusted to reflect the relative severity or resource to U.S. hospitals. Significant consolidation of both beds intensity of services using the Ambulatory Pay ment Classification (APC) system. Under prospect and hospitals continues each year. In 1991 there were tive payment mechanisms including per diem, case more than 5300 community hospitals and more than rate, DRG, per-procedure, and APC mechanisms, 920,000 beds. In 2001, that number had dropped to providers have an incentive to limit the operating nearly 4900 hospitals and 840,000 beds. By 2012, the costs incurred to provide services. decline in the number of hospitals had stabilized, with Passage of PPACA introduced a new model of 4999 in operation at that time, although the number healthcare delivery that mixes many of the payment of beds in operation had declined slightly to 800,566 mechanisms mentioned here-the Accountable (AHA, 2019). Meanwhile, demand has fluctuated. The Care Organization (ACO). An ACO is a group of number of admissions rose from 31,000,000 in 1997 various healthcare providers (sometimes referred to across all community hospitals to nearly 3 as a "network") that share financial responsibility for in 2016 and remained fairly static at that level (AHA, the care of a designated group of patients on behalf 2019). The rise in outpatient volumes has grown even of an insurer. Providers may be reimbursed for ser- vices using any of the methods described here, though more quickly, to well over 880 million physician office the payment amounts may be reduced to account for visits in 2018 (CDC, 2019). The chart in FIGURE 3-1 patient satisfaction or quality of care incentives built shows the change in hospital demand and supply over into ACO payment agreements. However, the overar- recent years. ching theme for reimbursement in an ACO is toward When supply is consolidated yet demand remains cost reduction for a population. That cost reduction strong, pricing and margins typically rebound. That is focus will lead to lower direct payment rates to pro- exactly what we have seen in hospitals recently. Profit viders, with possible additional payments for meeting margins shrank from around 4% in 2001 to 2.7% in ACO incentive goals. Similarly, the ACO could be 2012. While supply is starting to stabilize (the number responsible for penalties if incentive goals are not met. of community hospitals has remained around 4900 for Much like a capitation payment, the ACO arrange- the last 8 years), the industry is seeing declines in profit ment in general creates an incentive to reduce the margins after some increases during the prior decade amount of care provided and to maintain a fairly static level of operating cost. see FIGURE 3-2). Hopefully this trend will moderate, The financial implications from use of prospect although payment decreases mandated under PPACA tive payment mechanisms for hospital reimbursement will challenge the operations management field to are enormous. The risk and pressure of holding costs maintain margins at current levels. below collected net revenue is being transferred from Yet this tells only half of the story. Some research the payer to the provider. This change calls for a dif- suggests that nearly 50% of large hospitals have ferent type of administrator and the need for manag- negative operating margins (Langabeer, Lalani, ing costs, maximizing staff productivity, and limiting Champagne-Langabeer, & Helton, 2018). Investment unnecessary processes. income and ancillary sources of revenue can typically contribute between 20% and 50% of total margins for Profit Margins an average hospital. Therefore, real operating income margins at current levels are usually between 0.5% and Profit margins are found by subtracting expenses 1.5% across the board. With the continued rising cost from revenues, and they represent the residual value of medical technologies, equipment, and other capital to fund the future operations and capital investment. costs, sustaining an organization for the long term at Since the 1980s, the average profit margins for com- single digit margins is nearly impossible. munity hospitals have been extremely unsatisfactory. Economics suggest that with long-term industry profit margins near 0% on average, hospitals exit the mar- ket because it is unattractive to both new entrants and Income Statements current organizations, Hospitals exit through bank- ruptcy, acquisition by another competitor, or simply it is important to understand all components of a hos- dissolution. According to financial statements filed by pital's financials, This includes being able to look at hospitals in their annual reports to CMS, more than all of the key statements-income statement, balance sheet, and cash flow-and be able to utilize metrics and line items to fully understand a hospital's operation. The income statement is one of the most importantSOLLOL 8ZSVEZE Income Statements 37 ced nega- 37,000 860 over time both beds 36,000 840 here were 35,000 ore than opped to of Admissions (000) 34,000 820 2012, the 33,000 800 Supply: # of Beds (000) zed, with number 32,000 - 780 800,566 Demand: # 31,000 ted. The in 1997 30,000 - 760 400,000 (AHA, 29,000 740 1998 1999 2000 2001 2002 2003 2004 2005 2006 200> 2009 2009 wn even 2010 201 2013 201 2014 2015 2016 n office URE 3-1 Supply: Number of beds Demand: Number of admissions ly over FIGURE 3-1 Hospital Industry Economics: Inpatient Supply Falling and Demand Rising (Community Hospitals) emains Data from American Hospital Association Trendwatch Chartbook, 2018. That is Profit 8.0% .7% in 7.1% 7.0% 6.9%Bro 0 7.1% 6.8% umber 6.3% 6.4% 6.4% 900 for 6.0% 6.0% 6.0% - profit 5.0% decade 5.0% lerate, 4.0% PACA eld to 3.0% 2.6% 2.0% - search have 1.0% alani, 0.0% 2006 2007 2008 2009 2010 2011 2012 2013 2014 2015 2016 2017 ment ically FIGURE 3-2 Average Hospital Profit Margins ns for Data from Modern Healthcare, 2019. come o and cost ones, because it measures a hospital's profitability by and Healthcare Common Procedure Coding Sys- apital tracking revenues, expenses, and margins. It works off tem code. These codes represent the hospital, pro- fessional, and technical services provided, and they m at the basic accounting principle: are billed based on the pricing maintained in each Revenues - Expenses = Profit margin hospital's Charge Description Master (CDM). This CDM is a listing of all services and prices that the Beginning with the top line of the income hospital delivers; it is essentially a price list, based on statement, a hospital reports gross revenues. Gross gross charges to be billed to payers. An assumption hos- revenues represent the gross or total billings to all gov- for private payments or for co-pays or other out-of- ok at ernment and private insurers for patient care activi- pockets costs is that all billings that are the patient's lance ties. It is typically reported separately for outpatient responsibility will be paid in full. s and and inpatient activities. Gross revenue is the sum of A hospital's gross billings, however, do not rep- tion all services rendered, through bills issued to payers resent what will be realized, given that sizable dis- tant for every DRG, current procedural terminology, counts are taken based on contract negotiations107105 3234528 Chapter 3 Operational Finance 38 of the most important metrics for determining a hospi- (i.e., for private insurers) and for other rate caps, tal's financial health. As stated earlier, almost one-third allowances, exclusions, or limitations. A discount or of all hospitals had negative operating margins in the TABLE deductions category appears that reflects an allow- most recent year of publicly available financial data. An ance for payments that will probably not be collected. average operating margin of between 1% and 3% is very This could be because of exclusions, contractual common for most hospitals, especially larger urban ones. ABCH adjustments, discounts, or other deductions for the Smaller, rural hospitals tend to have even lower margins. difference between what is billed and what the insurer Most hospitals are able to improve their finan- Inco will pay. Deductions for many hospitals in 2012 aver- cial performance by maximizing the non-operating- or non-patient-related activities. These activities are Inpat aged between 30% and 70%, depending on the payer mix and types of services offered. For example, if a commonly referred to as "below the line" because Out hospital's CDM shows a price for a specific service they are not operating activities and are not reported such as a chest X-ray for $2500, that is the gross rev- in operating income. They include fundraising and Tota enue expected and would be consolidated with all donations, which can total between 5% and 10% of net other services performed to calculate the top line on income for a hospital or, based on industry-average Dec the income statement. Based on the payer mix repre- sented in the services offered in a specific period, there calculations, between $250,000 for a community hos- allo would be an adjustment to discount this based on the pital and $10 million for a larger teaching hospital. In reality of what the payer will reimburse. For instance, addition, investment and interest income is a major if the $2500 service was reimbursed by a payer at source of non-operating revenue. Many hospitals have $1000, then $1500 would appear in the deductions an in-house treasury or investment management pro- line accumulated with all other deductions, and $1000 fessional to help direct the movement of cash, manage would be added to net patient revenue. working capital, support bond and debt offerings, and The difference between gross revenues and dis- invest in various equity markets. The role of treasury counts and deductions is what is called net patient rev- professionals in hospitals is a fairly small field, but its enues. Net patient revenues are the actual expected impact can be quite significant, adding as much as revenues (gross revenues less deductions and allow- 20% to operating income. ances) for a hospital system and are more commonly A sample hospital income statement is shown in used for hospital comparisons than gross revenues. TABLE 3-1. Net patient revenue is the same as operating revenue. Under the expense side of the income statement, hospitals typically place their highest expenses first, followed by lesser categories. For instance, if per- Income Statement Ratio sonnel expense was $17,000 and supply expense was Analysis $15,000, then personnel expense would be the first expense category reported. Ratio analyses are important management control Depending on the level of detail that a hospital activities to ensure that operations are headed in the reports internally and externally, all expense catego- right direction and that they are competitive with ries can be hidden or aggregated to "total operating expense." Typically, the major categories that should other organizations. Ratios allow the details from be itemized include medical supply and drug expense, statements to be put into common formulas that help personnel or labor expense, administrative expense, track financial health and condition. There are several general service expense, teaching expense, nursing, key ratios that should be monitored to assess an orga- depreciation, and other operating expense. In other nization's financial condition, including profitability, statements, the separate major divisions are detailed liquidity, and efficiency. Specifically, ratios that mea- separately, such as intensive care unit, emergency, sure profit margins, return on capital (ROC), labor or obstetrics/gynecology. The two largest operating productivity, and supply expense are vital in health- expenses in most hospitals are typically personnel care operations management. and supply expenses, Labor expenses can account for nearly 60% of all costs, while supply and pharmaceuti cal expenses typically average around 20% to 30%. Profit Margin Ratios The difference between net patient revenue and total operating expense is operating income or operating One of the most common ratios examines operating margin, Operating margin reflects the profits cleared in margin and total margin percentages. Operating mar- gin is defined as: the course of normal business or operations and is one Operating margin = (Operating revenue - Operating cost) Operating revenueSOL/01 BESVEZE ermining a hospi- Income Statement Ratio Analysis 39 almost one-third TABLE 3-1 Hospital Income Statement this by the total revenue yields a 20.1% total margin g margins in the percentage. inancial data. An This is why it is important to understand the dif- % and 3% is very ABC Hospital-As of August 31, 2019 ference between total and operating margins. It is pos- arger urban ones. sible for a hospital to lose money in operations and n lower margins. Income Statement ($,000) still have positive total margins, or vice versa. Under- ove their finan- $1,500,300 standing this is essential to knowing which area to non-operating- Inpatient revenue focus on and how cost conscious the hospital will have e activities are 430,320 to be to reduce operating costs. line" because Outpatient revenue e not reported ndraising and Total patient revenue 1,930,620 Return on Capital and 10% of net Deductions, discounts, and (1,000,000) ROC is a measure of the level of financial return gen- ustry-average erated by a hospital's operations in a specific account- allowances mmunity hos- ing period. This return produces a ratio that can be g hospital. In Net patient revenues $930,620 compared with all hospitals and across other indus- he is a major tries. The higher a hospital's return on capital, the ospitals have Total operating expenses 830,220 better that hospital performed relative to the compe- agement pro- tition (although it is impossible to determine if a true ash, manage Operating income $100,400 economic profit-not accounting profit-has been fferings, and earned without analyzing the cost of capital). 5,200 of treasury Other income (donations, ROC is measured by multiplying a hospital's field, but its contributions, gifts) operating margin, expressed as a percentage, by the total asset turnover ratio. Although a more direct as much as Income from investments 15,001 method of calculating ROC would be to simply divide invested capital by net income, the effects of account- s shown in Governmental appropriations 0 ing changes, depreciation methods, and financing policies tend to distort the ratio, thereby reducing Auxiliary and non-patient 3,000 reliability and accuracy. ROC combines both income revenue statement and balance sheet variables and produces a reasonably optimal estimate of financial viability. Total non-patient revenue $23,201 Operating margin is calculated by subtracting oper- Total other expenses $124,400 ating expenses from the total operating revenue and it control dividing this figure by the total revenue generated. led in the Net income or (loss) ($799) Total asset turnover is calculated by dividing total itive with revenues by total assets, which will be discussed in the ails from balance sheet section. that help re several In the sample income statement shown in Table ROC = Earnings Before Interest & Taxes (EBIT) an orga- 3-1, total operating or net patient revenue was $930.6 Revenues fitability, million, and total operating expenses were $830.2 mil- Revenues at mea- lion. The margin was $100.4 million, or 10.8% of the X - Invested capital C), labor operating margin percentage-which, if this were a health- real hospital, would be an excellent margin percent- age, Total margin percentage is very similar. It is cal- Or culated as; ROC = Operating margin X Asset turnover (Total revenue - Total cost ) Total margin percentage = erating Total revenue x 100 Labor Productivity Ratios g mar- Other key analyses using income statement data Again, using the data in Table 3-1, where total involve analyzing the labor and nursing costs. Using a g cost) revenues were $953,821 and total costs were $954,620, combination of the personnel expense labor line plus the total margin in dollars was a loss of $799, Dividing hospital volume and activity indicators (e.g., numberSOLLOL 3234528 Chapter 3 Operational Finance 40 the type of specialty and patient acuity, it is important of discharges, number of beds, number of adjusted to focus on this area. Later chapters of this text will patient days), key staffing and productivity analyses help to focus efforts around: For exan can be conducted to see if the hospital is improving Reducing supply acquisition costs. $800, as in t over time or relative to competition. Reducing costs of holding inventory and storing DRGs perfor Consider this example. A hospital with 10,000 materials. per discharge annual discharges incurred a labor expense of $15 Speeding up the turn rates for supplies to a supply cos million. The labor cost per discharge (or labor cost) improve working capital and have overall higher then the adj would then be $1500 per discharge. If the same fig- pital would asset efficiencies. ures were $14.7 million and 8200 discharges a year ply utilization earlier, then the ratio would be $1793. This means To calculate supply ratios, there are several com- that the hospital did get more efficient or otherwise mon options for the denominator, such as supply had lower labor intensity from 1 year to the next. If, expense per discharge, supply expense per bed, Bala however, the neighboring hospital across the street, ply expense as a percentage of total operating expense, which offers the same set of services and is relatively and supply expense per adjusted patient discharge, Users of the same size, has a labor cost per discharge of $1200, Alternatively, pharmaceutical or drug expense could informed then there is still significantly more work that would be divided by the same denominators. condition need to be done to reduce costs and improve over- If a hospital has a total medical supplies and drug addition to all competitiveness. Obviously, the lower the figure, & Ward, the better, assuming that lower-paid employees do expense of $15,000,000, total operating revenues of of the acc not translate into lower-quality care or other service $100,000,000, and 15,000 annual discharges, they outcomes. Other similar ways to analyze personnel would have a 15% cost-to-revenue ratio and a $1000 expense are to use net patient revenue divided by the cost per discharge ratio. Compared with a similar hos- number of full-time equivalent employees (FTEs) to pital in the same geographic region with an $800 sup- Equit get revenue per employee. An FTE is a measure of ply cost per discharge, the competing hospital would organizat the total number of hours that an employee should be seen as more efficient and probably has greater lationship work (e.g., an employee that works 40 hours is con- profitability. liabilities sidered 1.0 FTE, while a part time 10-hour-per-week This all assumes, of course, that the complex- example employee is considered 0.25). Most hospitals typically ity or intensity of the types of patients the hospital the inco average between $80,000 and $120,000. The higher serves is relatively the same. An adjustment is neces looking the figure, the better the ratio and the more competi- sary to make these figures relative so that they can be accounts tive the hospital. compared across institutions. In theory, the greater monly the intensity, the more medical supplies that will be this exa Supply Expense Ratios consumed, and the lower the intensity, the fewer the suggest Because medical supplies and pharmaceutical supplies. A common way to adjust for patient mix dif- the fact expenses contribute so significantly to overall cost ferences between hospitals is to calculate a case mix cates th behaviors in hospitals, it is essential to analyze these index (CMI). Case mix index is calculated by averag invento expense categories separately (Healthcare Financial ing the DRG weighting for all patients served over the plies or Management Association, 2018). A key metric that course of an accounting period. All patients are coded accrued should be analyzed is supply cost per unit of patient with a DRG (representing the resource consumption pharma activity. Typically, if a hospital were primarily inpa- requirements based on a patient's diagnosis, treat- the bal tient based, the best denominators for all ratios would users to be inpatient days, number of admissions, or number ment, age, gender, and procedures performed), so the of discharges. DRG weights are the best-known indexes to adjust for simulta case mix. They typically are used only for Medicare Th Supply costs include the sum of all purchases of surgical supplies, general medical supplies, laboratory all costs. reimbursement, but the calculations can be applied to a histo time, supplies, oxygen and gases, linens, dietary products, radiology supplies, and office supplies. The added If the CMI turns out to be less than 1.0, then the poses, costs of freight and tax, less rebates and discounts, are supply cost per discharge would be greater than the and w also included in this supply expense category, original calculation. The formula is the key Because supply expenses can account for 15%- liabilit 50% of a hospital's operating expenses, depending on Supply cost per discharge a spec (Supply expense + Number of discharges) ment at reg CMI of eadSOU/O 3234528 nportant Working Capital 41 text will For example, if supply expense per discharge was accounting year-usually at the same time that an $800, as in the previous example, and the CMI for all income statement is prepared. Most hospitals are DRGs performed was 0.77, then the total supply cost either on an academic-year (i.e., September 1 through toring per discharge would be $1038. If another hospital had August 31) or calendar-year basis (i.e., January 1 a supply cost per discharge of $1200 but a CMI of 1.4, through December 31). then the adjusted cost would be $857. The second hos- When looking at the balance sheets, assets are igher pital would be considered to be more efficient in sup- listed first and they are arranged based on categories ply utilization. in decreasing order of liquidity, based on how quickly they can be turned into cash. Cash, therefore, is the com- first asset that appears under the asset section. Liabili upply Balance Sheet ties are listed second and are arranged in order of how sup soon they must be repaid or are due. Equity, or net ense, Users of hospital financial statements cannot make assets, is listed third on the balance sheet. A sample arge. informed decisions about the organization's financial balance sheet appears in TABLE 3-2. could condition without examining the balance sheet in An asset is anything the hospital owns that has addition to the income statement (Finkler, Calabrese, immediate or long-term monetary value. Examples of drug & Ward, 2018). A balance sheet is a representation assets are cash, marketable securities and investments, es of of the accounting equation: prepaid expenses, accounts receivable, inventories, they fixed assets (also called plant, property, and equip- 1000 Assets = Liabilities + Equity ment), and other assets. Assets can be further divided 10S- Equity is often called net assets in government into current and long-term, or long-lived, assets. Cur- up- rent assets are those that will be converted into cash organizations. There are simply too many interre- uld within 12 months or the current operating cycle, lationships among revenues, expenses, assets, and ter whichever is longer. Long-term assets are all those that liabilities to ignore either of these statements. For are longer than 1 year or the current operating cycle. example, assume that supply expenses reported on ex- Liabilities are the claims of all vendors and cred- the income statement were low for one month, but tal itors against the assets of the business and represent looking at the balance sheet you see an unusually high all debts owed by the hospital. Current liabilities are accounts payable balance. Accounting entries com- debts that must be paid within 1 year, such as accounts monly balance figures between both statements. In payable, short-term notes payable, accrued expenses, this example, a high accounts payable balance would taxes payable, and the current payment on long-term suggest that more supplies were purchased, despite debt. Long-term liabilities are amounts owed with a the fact that the actual expenses were lower. This indi- maturity of more than 1 year, such as mortgages pay- cates that the increase in supply purchases went into able and long-term bank notes. inventory and were not used. In the instance of sup- The difference between an organization's assets plies or pharmaceuticals, purchasing expenses can be and its liabilities is the net assets, equity, or net worth accrued and put on the balance sheet, and supplies or of the business. It represents the investment of the pharmaceutical expenses can be held in inventory on owners, plus any profits retained, minus any losses the balance sheet. These temporary differences require incurred. users to understand and interact with both statements simultaneously. The purpose of financial statements is to maintain Working Capital a historical perspective of financial performance over time, using standards to allow for comparison pur- Working capital is an important concept for oper- poses, which will allow one to diagnose the strengths ations management. Working capital is calculated by and weaknesses of a firm, A balance sheet, as one of subtracting current liabilities from current assets. The the key statements, is designed to show how the assets, excess of what will soon be converted to cash (cur- liabilities, and equity of the hospital are distributed at rent assets) minus the liabilities that will consume a specific point in time, It is often called the state- cash (current liabilities) is working capital. Concep- ment of financial position, It is usually prepared tually, it is the funds necessary to finance the operat- at regular intervals, such as each quarter, the end ing cycle for a hospital-from delivering services to of each month, and especially at the end of an receiving funds to paying invoices for materials used. lautner10710 3234528 Chapter 3 Operational Finance 42 The higher the figure, the more liquid a business is considered and the higher its ability to pay its debts" TABLE 3-2 Hospital Balance Sheet Working capital represents the levels of inven examines the percen ($,000) tory, cash, and accounts receivable on the books at ABC Hospital-As of August 31, 2019 any point in time. The current liabilities primarily debt, and is calculate represent payments to be made for accounts payable , such as supplies, materials, or services. From a supply Debt ra Assets chain perspective, both sides of the working capital For example, the Current Assets: equation are important because they reflect how effi- $325 ciently the hospital is ordering, storing, and paying for Cash and Equivalents goods and services. From a financial perspective, the $690 in total liabilit gives a 25% debt rat 175 equity is used to fin Short-term Investments amount of money in cash should be limited to as little 550 as possible, while still being able to make all required gest inefficient use Accounts Receivable, Net payments; the rest of the funds are held in market- a ratio suggests gre able securities or accounts that have higher exaggerate earning 250 higher yielding Inventories interest and investment income. The key with working Another imp 50 capital management is to match the amount of money inventory turnover Prepaid Expenses inventory turns is Total Current Assets $1,350 needed in the short term with the amount of funds available and keep all other assets in investments with higher returns, such as acquiring a new building that Inventory tur Long-term Assets: will produce clinical revenue or in an equity fund. Land and Buildings, Net $750 One common working capital indicator used to Cost of goo measure efficiency is the number of days of work- represent the co Property and Equipment, Net 500 ing capital that a hospital holds. If a hospital has are stored in inv $22 million in current assets, $15 million in current mean value rep Investments 200 liabilities, and has average monthly operating expense For example, on Total Long-term Assets 1,450 (minus depreciation) of about $26 million, then the inventory was re calculation would be: inventory was al Total Assets $2,800 Days of working capital = Assuming that t inventory turno Liabilities and Equity/Net Assets (CA-CL.)+/Operating expense -Depreciation Accounts re 360 nent to analyze, Current Liabilities: ($22,000,000-$15,000, 000) =($26,00,000=30) lections yet to b Accounts Payable converted into $360 $7,000,000+$866,667 =8.07 days of working capital calculation is c Taxes and Other Payables average collecti 40 Alternatively, working capital can be measured average the ho Accrued Liabilities 80 by its separate components, such as number of days ables into cash. of cash on hand or number of days of inventory. Other Current Liabilities 10 Understanding which component of working capital D Total Current Liabilities is increasing or decreasing over a period of time, or $490 relative to competitor hospitals, will help determine Long-term Liabilities: the drivers of changes to working capital and focus Using the operational management efforts. is $550 (in m Long-term Debt $2,585,056 ($ $180 Other Long-term Obligations Other Financial Ratios calculation is 20 an average of Total Liabilities $690 Common analyses performed on the balance sheet between 30 da Equity/Net Assets for operations management purposes include work- The last b $2, 110 Total Liabilities and Net Assets ing capital indicators, debt ratio, inventory utilization, focuses on the and asset management, among others. current liabil $2,800 liquid the hos An important measure for healthcare operations examines the percentage of debt that the organiza- tion maintains to sustain operations. The debt ratio CuSOLLO id a business is Cash Flow Statement 43 o pay its debts. levels of inven- examines the percentage of total assets financed by Using the data in Table 3-2, current assets are on the books at debt, and is calculated as follows: $1350 and current liabilities are $490. Therefore, the ilities primarily current ratio is 2.75. In general, a higher ratio indi- counts payable, Debt ratio = Total liabilities Total assets cates a larger safety margin, but it might also suggest From a supply inefficient use of assets, since the higher returning working capital assets typically are long-term investments. effect how effi- For example, the balance sheet in Table 3-2 showed and paying for $690 in total liabilities and $2800 in total assets, which gives a 25% debt ratio. The lower the figure, the more rspective, the equity is used to finance operations, which could sug- Cash Flow Statement ited to as little gest inefficient use of debt. On the other hand, too high The third and most common financial statement is e all required a ratio suggests greater debt exposure, which tends to the statement of cash flows (also known as the cash ld in market- exaggerate earnings artificially. flow statement or the funds statement). Cash is gher yielding Another important balance sheet ratio is the required to pay short-term bills, to fund payroll, and with working inventory turnover ratio. The simplest way to calculate to finance daily operations. But monitoring the cash int of money inventory turns is: balance sitting in bank accounts is not sufficient to int of funds COG fully understand how it is being earned, and how it stments with Inventory turnover ratio = s being used. uilding that Average inventory For public companies traded on stock exchange ity fund. markets, the Securities and Exchange Commission tor used to Cost of goods sold (COGS) is the term used to requires disclosure and reporting of a company's cash s of work- represent the cost of the materials or supplies that flows. In the healthcare industry, which is primarily ospital has are stored in inventory, and average inventory is the nonprofit, there is significantly less use of the state- in current mean value reported between two financial reports. ment of cash flows; even if it is not required, it should For example, on the balance sheet in Table 3-2 the be utilized. ng expense , then the inventory was reported at $250. If in the previous year, The statement of cash flows represents all of inventory was also $250, the mean inventory is $250. the cash inflows a hospital receives from its ongoing Assuming that total cost of goods sold was $2500, the business activities and investments, as well as its cash inventory turnover ratio would be 10 ($2500 + $250). outflows for expenditures, labor, and other activ- Accounts receivable (AR) is an important compo ities. The cash flow statement shows both sources tion nent to analyze, because it represents future cash col- and uses of funds and reconciles both the income lections yet to be recognized. The faster that this can be statement and the balance sheet back to changes in 30) converted into cash, the better. The most common AR cash flow. calculation is called "days sales outstanding" (DSO) or The cash flow statement is very useful to help ana- g capital average collection period, which defines how long on lyze whether business activities are positively or neg- average the hospital has to wait to convert the receiv- atively affecting a hospital's cash position. With most measured ables into cash. It is calculated as: hospitals maintaining cash reserves of several days to r of days several weeks of operations, it is important that busi- ventory. DSO = Accounts receivable ness managers closely examine their efforts to ensure g capital Revenue + 360) they are positively contributing to cash flows over time, or time. termine Using the earlier figure, total accounts receivable Information from this statement helps a hospi- d focus is $550 (in millions) and daily revenue averages are tal better manage its cash position, which is a critical $2,585,056 ($930,620,200 + 360). Therefore, the DSO component of working capital. It is a vital metric that calculation is 212 days, In most modern hospitals, hospital administrators must focus on to ensure that an average of days of AR outstanding is somewhere more cash is being "earned than burned." Knowing between 30 days and 75 days. whether a change in cash position is due to opera- e sheet The last balance sheet ratio that is quite common tions (i.e., inflows and outflows related directly to work- focuses on the relationship between current assets and services provided in the normal course of observ- zation, current liabilities because it suggests how solvent or ing, diagnosing, and treating patients) or whether liquid the hospital is. The current ratio is calculated as: they come from investments or financing activities is rations essential to understanding a hospital's true financial Current ratio = Current assets aniza- position. A sample statement of cash flows is pro- t ratio Current liabilities vided in TABLE 3-3.82 Chapter 3 Operational Finance operating activities formula looks at the beginning 44 and ending income statement and balance sheet and performs the following computation: TABLE 3-3 Statement of Cash Flows $,000 ABC Hospital-As of August 31, 2019 +Net income + Decrease in current assets (if any) Cash Flow from Operations +Increase in current liabilities (if any) $1,500 Net Earnings +Depreciation + Amortization of any intangible assets 45 Depreciation + Amortization of bond discounts 15 Decrease in Accounts Receivable + Any operating losses -Increase in current assets (if any) Increase in Taxes Payable -Decrease in current liabilities (if any) (25) Less Decrease in Accounts Payable -Amortization of bond premiums (15 ) Less Increase in Inventory -Operating gains = Net cash provided (used) by operating activities Net Cash from Operations $1,522 Cash Flow from Investing Similarly, a calculation for investing activities looks at both long-term assets bought or sold, as well Equipment Purchases $400) as short- and long-term investments. Finally, a net cash Net Cash from Investing ($400 ) flow from financing activities explores the changes in long-term liabilities; any dividends payable; and any Cash Flow from Financing issuing stock, treasury stock, and debt (although these are less common in most nonprofit hospitals). The net Notes Payable $15 cash flow sums all three of the components to see the changes in net cash flow used or provided by operat- Net Cash from Financing $15 ing, investing, and financing activities, and it gives a Cash Flow from FY2019, Net very clear picture of whether the organization gener- $1,137 ated or burned cash during the period. Cash flow statements can be produced in two for- mats: direct and indirect. The indirect method appears Audited Financial Statements to be most commonly used, probably because of its simplicity. The indirect method reconciles net income All of the three financial statements described in this as the top line and makes adjustments for all entries chapter-income statement, balance sheet, and state- that do not affect cash. Depreciation, for example, ment of cash flows-help show the overall financial reduces net income, but because it is a noncash activ- health and condition of a hospital. However, obtain- ity, it will be added back to reconcile to the cash flow ing these statements for benchmark comparisons with position. The direct method reports cash outflows and inflows only, without attempting to make recon- other hospitals is very difficult. For-profit, or publicly ciling adjustments back to net income, Both meth- traded, firms are required to disclose their statements ods produce the same results, which is net cash used to the public as a condition of being listed on a stock or provided by all types of operating, investing, and financing activities, exchange, but most hospitals are nonprofit and so are not regulated by the same rules. However, because Under the operating activities, the indirect most hospitals secure financing through debt, or the method sums all cash inflows and outflows primarily public bond market, audited financial statements are from the income statement items (e.g., net income, adjustments), but it also looks at changes in current nearly always required to obtain financing through assets and liabilities. The calculation of cash flows for bond rating agencies. Hospital financial statements can be obtained either directly from the hospital, from the Internal Revenue Service for certain charitable hospitals that file a Form 990, from an organization107105 8ZSZEZE Implications for Operations and Logistics Management 45 ning designated as a nationally recognized municipal secu- Credit ratings in healthcare financing are typically and rities information repository by the Securities and done by one of four organizations: Standard and Poor's Exchange Commission, or, finally, from the Medicare (S&P), Moody's Investor Services, AM Best Com- cost report. any, and Fitch IBCA. Each of these organizations has The best source of information to use for con- developed separate rating schedules to evaluate the ducting operational analyses is audited financial volatility and worth of those seeking credit. For exam- statements, which are prepared or reviewed by an inde- ple, S&P uses AAA as the highest overall rating given pendent accounting firm. The independent accoun to an organization, which represents the least amount tant attests, based on examinations and reviews, that of total risk, down to B2 for those that are most risky the statements fairly present the financial condition as and speculative. of a certain period and were compiled in accordance with accounting principles. Audited financial state- ments give some reassurance that the overall financial Implications for Operations statements are presented fairly, which is a potential problem for organizations that do not have to comply and Logistics Management with generally accepted accounting principles. All departments, functions, and managers play a role in improving the financial condition of hospitals. Debt in Health Care Understanding the impact of operational activities and how they translate into the financial statements One of the most common ways to finance capital of the hospital (which measure the changes in finan- investments for the future is through debt. Debt is cial performance over time) are requirements for recorded on the balance sheet and can be payable improving the level of competitiveness and opera- in the short term (less than 1 year) or the long term tional effectiveness for a hospital. Operations man- (amortized over a period of greater than 1 year). There agers, however, must take the leadership role in this is a cost to finance the business using debt, as there is effort. with all sources of funds, although some forms of debt The relationship between operations and working are better than others. Simple forms of debt finance capital needs to be well defined and managed. When ing entail using organizational purchasing cards from analyzing any project for a department, the working banks with revolving lines of credit and an associated capital consumed needs to be calculated for that area interest charge. Short-term working capital loans are to examine how it contributes, positively or negatively, offered by financial institutions to cover short-term to the institution. Similarly, operations managers must imbalances in asset and liability accounts, primarily check that AR and accounts payable align and match when AR is slower moving than accounts payable. to ensure that money is not being paid out faster than Hospitals tend to use capital equipment leases for it comes in. Exploring changes in inventories for key large items when vendors offer very attractive terms, nursing units and materials management departments but for very large investments (e.g., new building, new is also necessary to ensure that supplies are being used major pieces of equipment), the use of public health- properly and that there is an efficient utilization or care bonds is usually the desired debt vehicle. turnover in assets. Bonds are debt instruments issued by a health- The linkage between the revenue cycle and the care organization to the public; the organization is supply chain must also be integrated faster and with obligated to repay the original principal plus interest less manual effort. There should be real-time inte- for the period the debt was outstanding. Bonds can be gration between supply charges and patient medical very complex and often require both external legal and in records when dispensed so that as new items are added financial assistance in their offers. The amount of inter- to the item master, they are seamlessly integrated with est that organizations must repay is directly related to the CDM, eliminating unnecessary manual steps and their credit ratings: organizations that are the most reviews. successful, profitable, and the most creditworthy will Also, focusing on increasing the labor produc- have the best ratings and, therefore, will have lower tivity for staff in support and clinical areas can mean interest rates. This is because the public views these reducing wait times for patients and lowering labor organizations as being more stable and less risky; thus, costs for the hospital. Understanding where these they are willing to take a smaller return, Contrary to costs are stored in the institution's financial systems this, the more "risky" firms (i.e., those that have lower and reports is necessary so that operations managers credit ratings) will have higher interest. can use the right data in their analyses.Chapter 3 Operational Finance 46 Chapter Summary Refere bankruptcy and other financial distress. The financial American The role that business operations managers play in condition of a hospital is measured through one of Chica three key statements: the income statement, the bal. Centers for improving a hospital's financial condition is a contin- uous and ever-increasing process. Operations man- ance sheet, and the statement of cash flows. Working utili capital is an important concept that focuses on opera. Pre agers must know where financial data reside in their tional efficiency. Ratio analyses help analyze whet /ph hospitals-in which systems and financial reports-if they are to be able to use them in quantitative anal- the hospital is profitable, liquid, burdened with debt, Centers Act yses focused on operational efficiencies. A hospital's or nearing bankruptcy. Analyzing the impact that Wa Center revenue is being constrained by all payers' attempts operational management has on a hospital's overall to reduce utilization of services and use competitive performance and financial health is evident only by means to reduce reimbursement rates. This translates understanding these statements and by using ratios into lower revenues and profit margins. A hospital and metrics that show trends over time. therefore has to continually focus on maximizing financial performance to ensure its survival and avoid Key Terms Payer Accountable Care Organization Commercial insurers (ACO) Cost of goods sold (COGS) Per diem Ambulatory Payment Classification Deductions Profit margins (APC) Fee-for-service (FFS) Prospective payment Asset Income statement Reimbursements Balance sheet Liabilities Retrospective Bonds Managed care Statement of cash flows Capitation Medicaid Case mix index (CMI) Statement of financial position Medicare Case rate Working capital Net patient revenues Discussion Questions 1. Why should operations managers understand financial statements? 2. What constrains a hospital's revenue? 3. Compare and contrast the incentives to healthcare providers under a fee-for-service reimbursement mech- 4. anism versus a prospective payment mechanism. related? What are the three key financial statements that business managers should be aware of, and how are they 5. What is the logic of the order of the assets listed on the balance sheet? What is a financial ratio? What value does it provide? 7. Why do organizations have their statements audited? What assurance does it provide? 8. What is the principal difference between the direct and indirect methods for preparing the cash flow statement? Exercise Problems 2 . deduction percentage for that period? 1, A hospital has $25 million in gross revenues and $12 million in net patient revenues. What is the average 3 . maintain this period? The same hospital has $40 million in current assets and $30 million in current liabilities. During a 30-day capital in 2019, month, they incurred total operating expenses of $10 million. How many days of working capital did they Using the income statement and balance sheet examples provided in the chapter, calculate the return on
Step by Step Solution
There are 3 Steps involved in it
1 Expert Approved Answer
Step: 1 Unlock
Question Has Been Solved by an Expert!
Get step-by-step solutions from verified subject matter experts
Step: 2 Unlock
Step: 3 Unlock
Students Have Also Explored These Related Finance Questions!