

Question
Based on data provided in Exhibit 8, use the discounted cash flow (DCF) approach to estimate Ferraris stock price before the IPO. In your calculation,
Based on data provided in Exhibit 8, use the discounted cash flow (DCF) approach to estimate Ferraris stock price before the IPO. In your calculation, please assume the following: tax rate is 38%, the 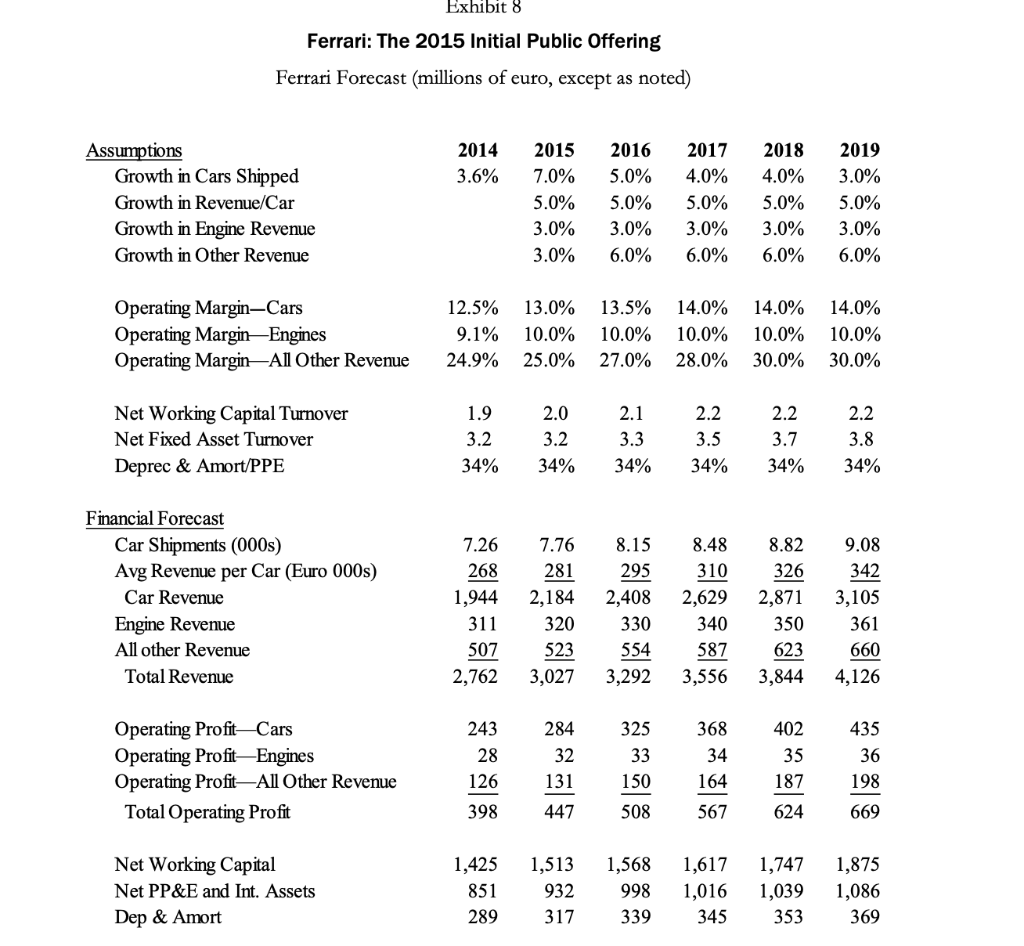 discount rate is 5%, and cash flows grow at a constant rate of 3% each year forever beyond 2019.
How do you think the IPO will affect Ferrari? Discuss the potential benefits and costs.
Exhibit 8 Ferrari: The 2015 Initial Public Offering Ferrari Forecast (millions of euro, except as noted) 2014 3.6% Assumptions Growth in Cars Shipped Growth in Revenue/Car Growth in Engine Revenue Growth in Other Revenue 2015 7.0% 5.0% 3.0% 3.0% 2016 5.0% 5.0% 3.0% 6.0% 2017 4.0% 5.0% 3.0% 6.0% 2018 4.0% 5.0% 3.0% 6.0% 2019 3.0% 5.0% 3.0% 6.0% Operating Margin-Cars Operating Margin-Engines Operating Margin-All Other Revenue 12.5% 9.1% 24.9% 13.0% 10.0% 25.0% 13.5% 10.0% 27.0% 14.0% 10.0% 28.0% 14.0% 14.0% 10.0% 10.0% 30.0% 30.0% Net Working Capital Turnover Net Fixed Asset Turnover Deprec & Amort/PPE 1.9 3.2 34% 2.0 3.2 34% 2.1 3.3 34% 2.2 3.5 34% 2.2 3.7 34% 2.2 3.8 34% Financial Forecast Car Shipments (000s) Avg Revenue per Car (Euro 000s) Car Revenue Engine Revenue All other Revenue Total Revenue 7.26 268 1,944 311 507 2,762 7.76 281 2,184 320 523 3,027 8.15 295 2,408 330 554 3,292 8.48 310 2,629 340 587 3,556 8.82 326 2,871 350 623 3,844 9.08 342 3,105 361 660 4,126 243 284 32 Operating Profit-Cars Operating Profit-Engines Operating Profit-All Other Revenue Total Operating Profit 28 126 398 325 33 150 508 368 34 164 567 402 35 187 435 36 198 131 447 624 669 Net Working Capital Net PP&E and Int. Assets Dep & Amort 1,425 851 289 1,513 932 317 1,568 998 339 1,617 1,016 345 1,747 1,039 353 1,875 1,086 369 Exhibit 8 Ferrari: The 2015 Initial Public Offering Ferrari Forecast (millions of euro, except as noted) 2014 3.6% Assumptions Growth in Cars Shipped Growth in Revenue/Car Growth in Engine Revenue Growth in Other Revenue 2015 7.0% 5.0% 3.0% 3.0% 2016 5.0% 5.0% 3.0% 6.0% 2017 4.0% 5.0% 3.0% 6.0% 2018 4.0% 5.0% 3.0% 6.0% 2019 3.0% 5.0% 3.0% 6.0% Operating Margin-Cars Operating Margin-Engines Operating Margin-All Other Revenue 12.5% 9.1% 24.9% 13.0% 10.0% 25.0% 13.5% 10.0% 27.0% 14.0% 10.0% 28.0% 14.0% 14.0% 10.0% 10.0% 30.0% 30.0% Net Working Capital Turnover Net Fixed Asset Turnover Deprec & Amort/PPE 1.9 3.2 34% 2.0 3.2 34% 2.1 3.3 34% 2.2 3.5 34% 2.2 3.7 34% 2.2 3.8 34% Financial Forecast Car Shipments (000s) Avg Revenue per Car (Euro 000s) Car Revenue Engine Revenue All other Revenue Total Revenue 7.26 268 1,944 311 507 2,762 7.76 281 2,184 320 523 3,027 8.15 295 2,408 330 554 3,292 8.48 310 2,629 340 587 3,556 8.82 326 2,871 350 623 3,844 9.08 342 3,105 361 660 4,126 243 284 32 Operating Profit-Cars Operating Profit-Engines Operating Profit-All Other Revenue Total Operating Profit 28 126 398 325 33 150 508 368 34 164 567 402 35 187 435 36 198 131 447 624 669 Net Working Capital Net PP&E and Int. Assets Dep & Amort 1,425 851 289 1,513 932 317 1,568 998 339 1,617 1,016 345 1,747 1,039 353 1,875 1,086 369Step by Step Solution
There are 3 Steps involved in it
Step: 1

Get Instant Access to Expert-Tailored Solutions
See step-by-step solutions with expert insights and AI powered tools for academic success
Step: 2

Step: 3
Ace Your Homework with AI
Get the answers you need in no time with our AI-driven, step-by-step assistance
Get Started
Advanced Models And Tools For Effective Decision Making Under Uncertainty And Risk Contexts
Authors: Vicente González-Prida, María Carmen Carnero
1st Edition
1799832465,179983249X