Answered step by step
Verified Expert Solution
Question
1 Approved Answer
Based on information you have, you believe the supply and demand curves for an individual market are as follows (5 points each part of

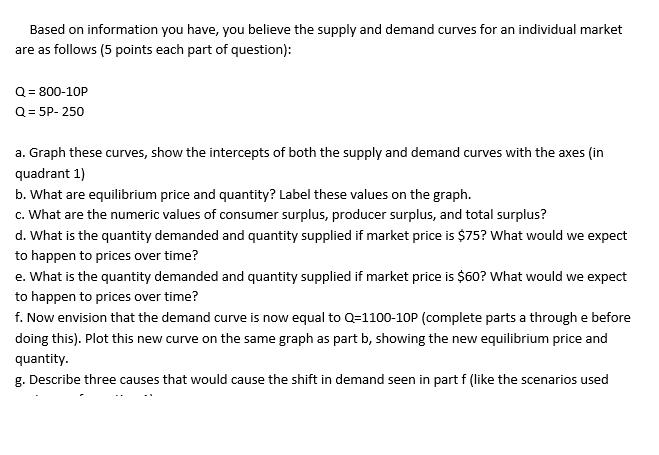
Based on information you have, you believe the supply and demand curves for an individual market are as follows (5 points each part of question): Q = 800-10P Q = 5P-250 a. Graph these curves, show the intercepts of both the supply and demand curves with the axes (in quadrant 1) b. What are equilibrium price and quantity? Label these values on the graph. c. What are the numeric values of consumer surplus, producer surplus, and total surplus? d. What is the quantity demanded and quantity supplied if market price is $75? What would we expect to happen to prices over time? e. What is the quantity demanded and quantity supplied if market price is $60? What would we expect to happen to prices over time? f. Now envision that the demand curve is now equal to Q=1100-10P (complete parts a through e before doing this). Plot this new curve on the same graph as part b, showing the new equilibrium price and quantity. g. Describe three causes that would cause the shift in demand seen in part f (like the scenarios used
Step by Step Solution
There are 3 Steps involved in it
Step: 1

Get Instant Access to Expert-Tailored Solutions
See step-by-step solutions with expert insights and AI powered tools for academic success
Step: 2

Step: 3

Ace Your Homework with AI
Get the answers you need in no time with our AI-driven, step-by-step assistance
Get Started


