

Answered step by step
Verified Expert Solution
Question
1 Approved Answer
based on n = 23 observations. The original datasets had the following proportions of successes: p=0.13, p=0.22, p = 0.30, p = 0.43 A
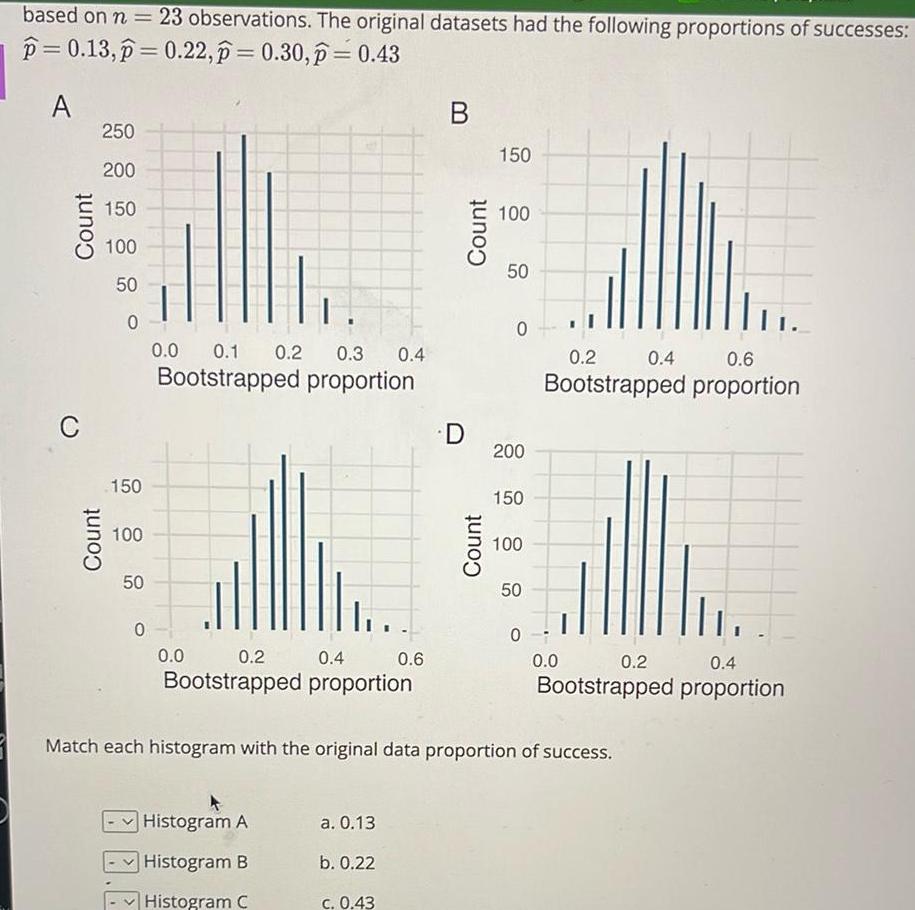
based on n = 23 observations. The original datasets had the following proportions of successes: p=0.13, p=0.22, p = 0.30, p = 0.43 A B C Count Count 250 200 150 100 50 150 100 50 Count 150 100 50 50 0 0.0 0.1 0.2 0.3 0.4 Bootstrapped proportion 0 0.2 0.4 0.6 Bootstrapped proportion 0 0.0 0.2 0.4 D 200 150 Count 100 50 0 0.6 0.0 0.2 0.4 Bootstrapped proportion Bootstrapped proportion Match each histogram with the original data proportion of success. Histogram A a. 0.13 Histogram B b. 0.22 Histogram C c. 0.43
Step by Step Solution
There are 3 Steps involved in it
Step: 1

Get Instant Access to Expert-Tailored Solutions
See step-by-step solutions with expert insights and AI powered tools for academic success
Step: 2

Step: 3
Ace Your Homework with AI
Get the answers you need in no time with our AI-driven, step-by-step assistance
Get Started
Quantitative Methods For Business Management And Finance
Authors: Louise Swift, Sally Piff
2nd Edition
1403935289, 9781403935281