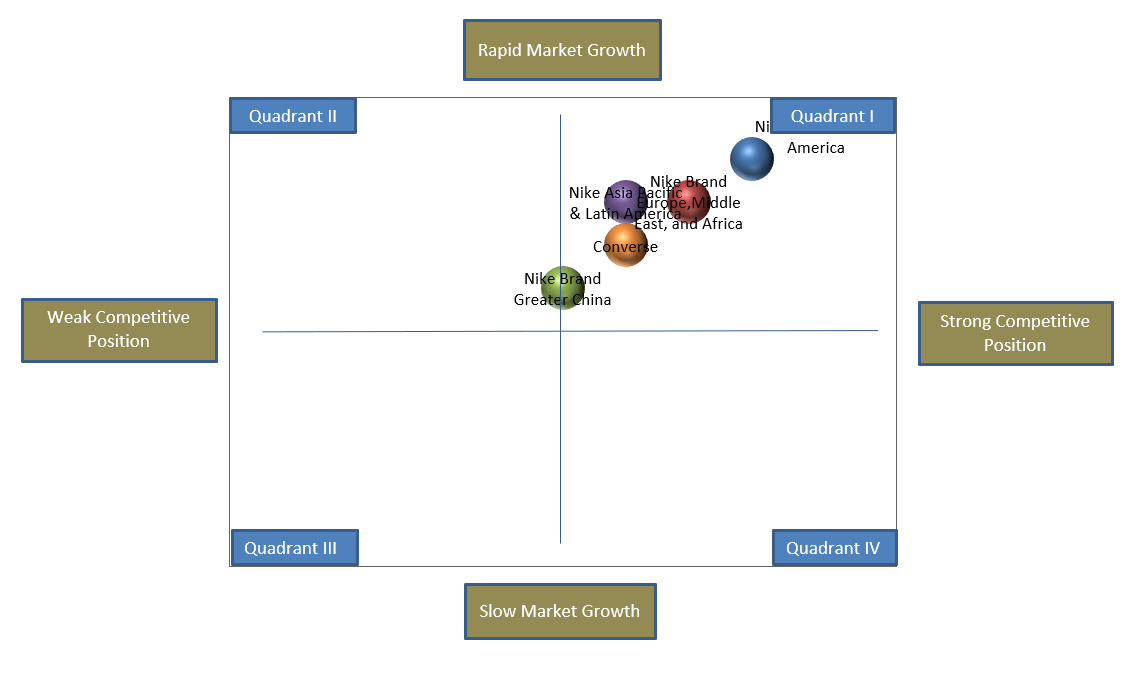
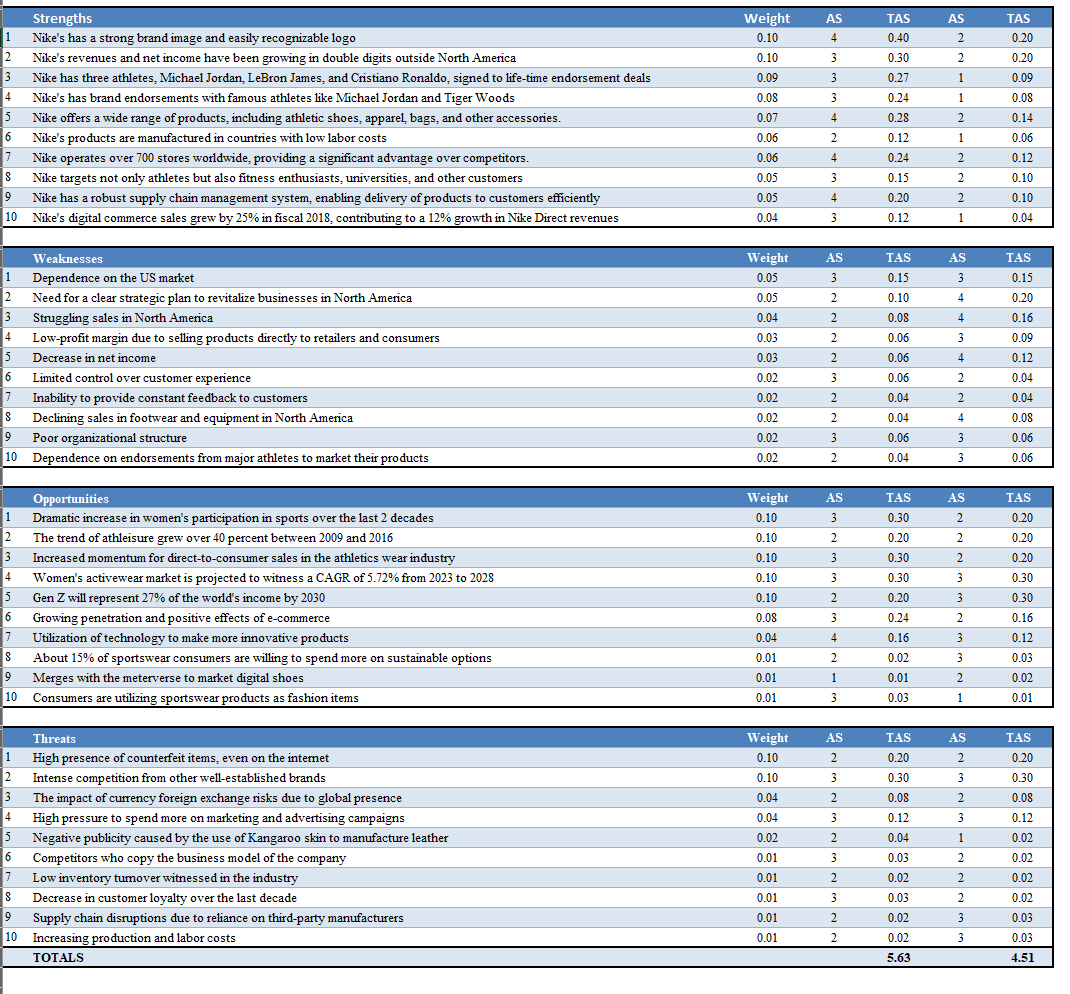
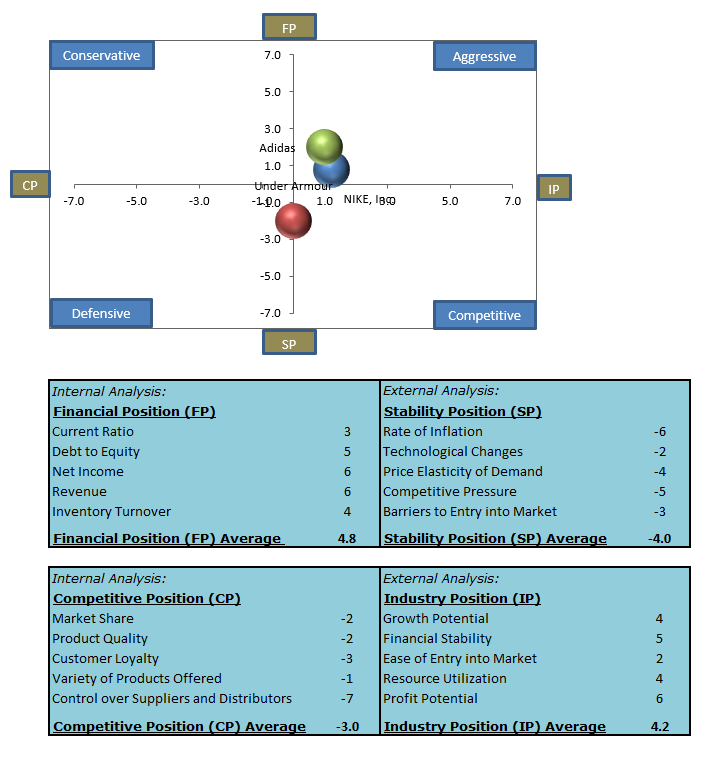
Based on the attached matrices for NIKE INC, What is the significance of the SPACE Matrix, Grand Strategy Matrix and the Quantitative Strategic Planning Matrices
Based on the attached matrices for NIKE INC, What is the significance of the SPACE Matrix, Grand Strategy Matrix and the Quantitative Strategic Planning Matrices (attached images for NIKE INC) in regards to strategic planning?
Rapid Market Growth Quadrant II Ni Quadrant I America Nike Brand Nike Asia Pacific Grope, Middle & Latin America East, and Africa Converse Nike Brand Greater China Weak Competitive Strong Competitive Position Position Quadrant III Quadrant IV Slow Market GrowthStrengths Weight AS TAS AS TAS Nike's has a strong brand image and easily recognizable logo ).10 4 0.40 2 0.20 Nike's revenues and net income have been growing in double digits outside North America 0.10 0.30 2 0.20 Nike has three athletes, Michael Jordan, LeBron James, and Cristiano Ronaldo, signed to life-time endorsement deals 0.09 0.27 0.09 Nike's has brand endorsements with famous athletes like Michael Jordan and Tiger Woods 0.08 0.24 0.08 Nike offers a wide range of products, including athletic shoes, apparel, bags, and other accessories. 0.07 0.28 0.14 Nike's products are manufactured in countries with low labor costs 0.06 0.12 0.06 Nike operates over 700 stores worldwide, providing a significant advantage over competitors. 0.06 0.24 0.12 S Nike targets not only athletes but also fitness enthusiasts, universities, and other customers 1.05 0.15 0.10 Nike has a robust supply chain management system, enabling delivery of products to customers efficiently 0.05 0.20 0.10 10 Nike's digital commerce sales grew by 25% in fiscal 2018, contributing to a 12% growth in Nike Direct revenues 0.04 0.12 0.04 Veaknesses Weight AS TAS AS TAS Dependence on the US market 0.05 0.15 0.15 NOW Need for a clear strategic plan to revitalize businesses in North America 0.05 0.10 0.20 Struggling sales in North America 1.04 0.08 0.16 Low-profit margin due to selling products directly to retailers and consumers ).03 0.06 0.09 Decrease in net income 0.03 0.06 0.12 Limited control over customer experience 0.02 0.06 0.04 Inability to provide constant feedback to customers 0.02 0.04 0.04 Declining sales in footwear and equipment in North America 0.02 0.04 0.08 Poor organizational structure 0.02 0.0 0.06 10 Dependence on endorsements from major athletes to market their products 0.02 0.04 0.06 Opportunities Weight AS TAS AS TAS Dramatic increase in women's participation in sports over the last 2 decades 0.10 3 0.30 0.20 The trend of athleisure grew over 40 percent between 2009 and 2016 0.10 0.20 0.20 Increased momentum for direct-to-consumer sales in the athletics wear industry 0.10 0.30 0.20 Women's activewear market is projected to witness a CAGR of 5.72% from 2023 to 2028 0.10 0.30 0.30 Gen Z will represent 27% of the world's income by 2030 0.10 0.20 0.30 Growing penetration and positive effects of e-commerce 0.08 0.24 0.16 Utilization of technology to make more innovative products 0.04 0.16 0.12 About 15% of sportswear consumers are willing to spend more on sustainable options 0.01 2 0.02 0.03 Merges with the meterverse to market digital shoes 0.01 0.01 0.02 10 Consumers are utilizing sportswear products as fashion items 0.01 0.03 0.01 Threats Weight AS TAS AS TAS High presence of counterfeit items, even on the internet 0.10 0.20 0.20 Intense competition from other well-established brands 0.10 0.30 0.30 The impact of currency foreign exchange risks due to global presence 0.08 0.08 High pressure to spend more on marketing and advertising campaigns 0 04 0.12 0.12 Negative publicity caused by the use of Kangaroo skin to manufacture leather 0.02 0.04 0.02 Competitors who copy the business model of the company 0.01 0.03 0.02 Low inventory turnover witnessed in the industry 0.01 0.02 0.02 S Decrease in customer loyalty over the last decade 0.01 0.03 2 0.02 9 Supply chain disruptions due to reliance on third-party manufacturers ).01 0.02 0.03 10 Increasing production and labor costs 0.01 2 0.02 0.03 TOTALS 5.63 1.51\f
Step by Step Solution
There are 3 Steps involved in it
Step: 1
Get Instant Access to Expert-Tailored Solutions
See step-by-step solutions with expert insights and AI powered tools for academic success
Step: 2
Step: 3
Ace Your Homework with AI
Get the answers you need in no time with our AI-driven, step-by-step assistance