

Answered step by step
Verified Expert Solution
Question
1 Approved Answer
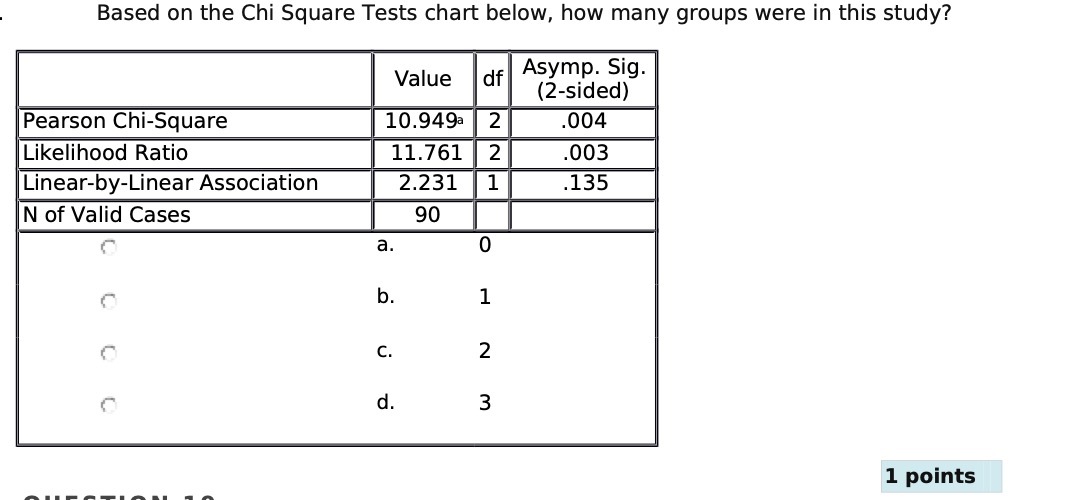
Based on the Chi Square Tests chart below, how many groups were in this study? Value df Asymp. Sig (2-sided) Pearson Chi-Square 10.949a 2 004

Step by Step Solution
There are 3 Steps involved in it
Step: 1

Get Instant Access to Expert-Tailored Solutions
See step-by-step solutions with expert insights and AI powered tools for academic success
Step: 2

Step: 3
Ace Your Homework with AI
Get the answers you need in no time with our AI-driven, step-by-step assistance
Get Started
Understanding Public Opinion Polls
Authors: Jelke Bethlehem
1st Edition
1498769756, 9781498769754