

Answered step by step
Verified Expert Solution
Question
1 Approved Answer
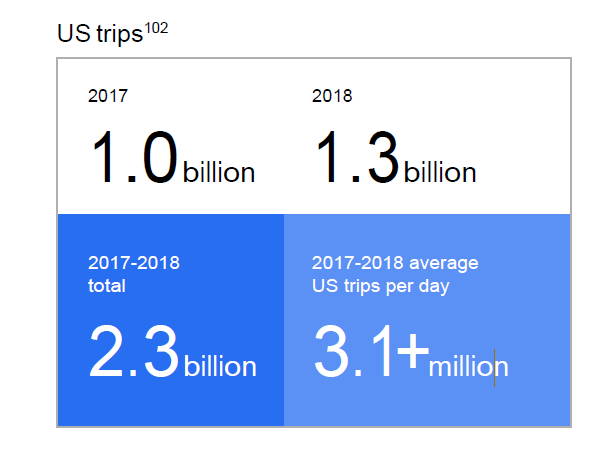
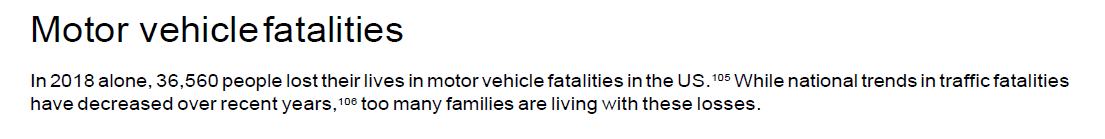
Based on the Data Below is Uber's statistics show Uber is more Safe , the same, or less safe in the United States than with

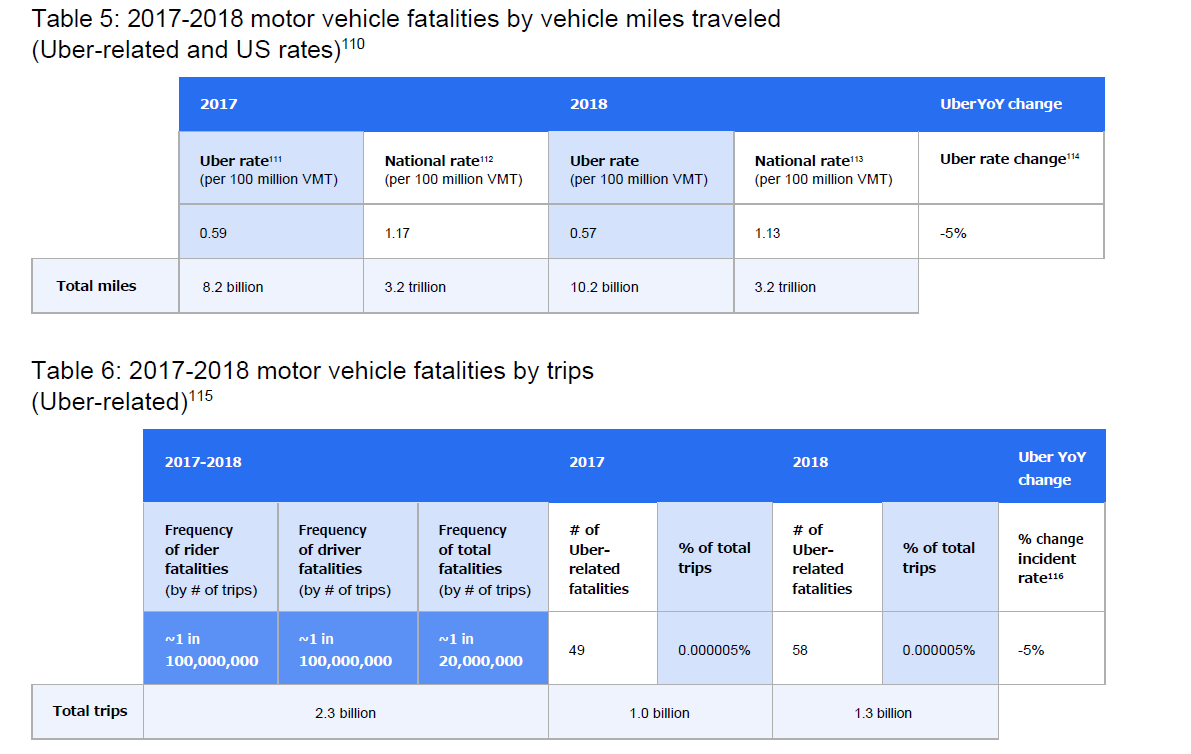

Based on the Data Below is Uber's statistics show Uber is more Safe , the same, or less safe in the United States than with that of the totality of vehicle incidents in the US and Why?


Step by Step Solution
There are 3 Steps involved in it
Step: 1

Get Instant Access to Expert-Tailored Solutions
See step-by-step solutions with expert insights and AI powered tools for academic success
Step: 2

Step: 3
Ace Your Homework with AI
Get the answers you need in no time with our AI-driven, step-by-step assistance
Get Started
College Geometry Using The Geometer's Sketchpad
Authors: Barbara E Reynolds, William E Fenton
1st Edition
1118213408, 9781118213407