Answered step by step
Verified Expert Solution
Question
1 Approved Answer
Based on the data graph, ACF and PACF above, answer question a), b) and c): What are the components (trend, cycles or seasonality) that

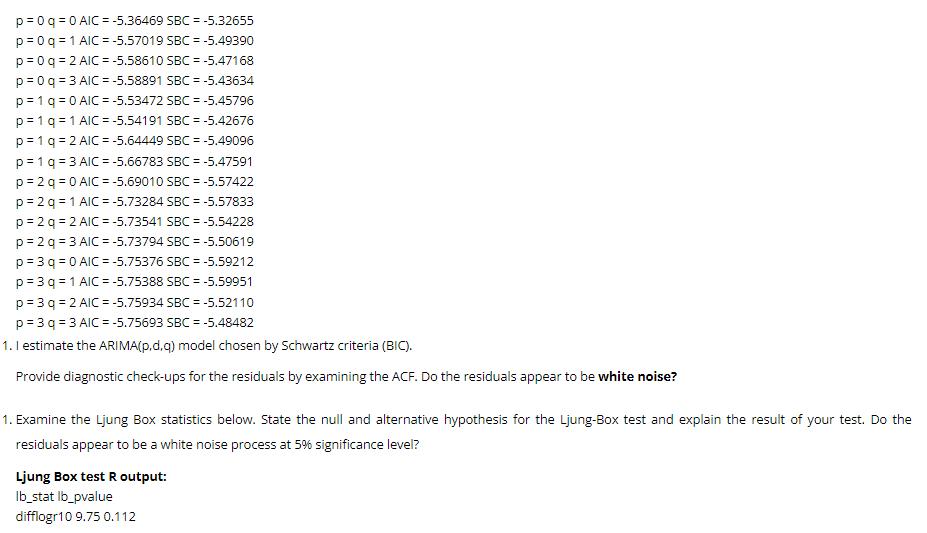
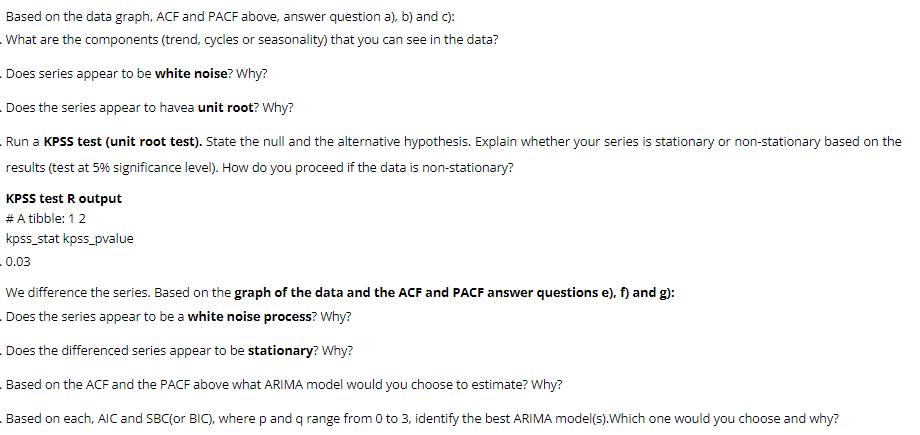
Based on the data graph, ACF and PACF above, answer question a), b) and c): What are the components (trend, cycles or seasonality) that you can see in the data? Does series appear to be white noise? Why? Does the series appear to havea unit root? Why? Run a KPSS test (unit root test). State the null and the alternative hypothesis. Explain whether your series is stationary or non-stationary based on the results (test at 5% significance level). How do you proceed if the data is non-stationary? KPSS test R output # A tibble: 1 2 kpss_stat kpss_pvalue 0.03 We difference the series. Based on the graph of the data and the ACF and PACF answer questions e), f) and g): Does the series appear to be a white noise process? Why? Does the differenced series appear to be stationary? Why? Based on the ACF and the PACF above what ARIMA model would you choose to estimate? Why? Based on each, AIC and SBC(or BIC), where p and q range from 0 to 3, identify the best ARIMA model(s). Which one would you choose and why? p=0q 0 AIC p 0q 1 AIC -5.36469 SBC= -5.32655 -5.57019 SBC -5.49390 p=0q 2 AIC -5.58610 SBC = -5.47168 p 0q 3 AIC -5.58891 SBC -5.43634 p 1 q 0 AIC -5.53472 SBC = -5.45796 p 1 q 1 AIC -5.54191 SBC -5.42676 p 1 q 2 AIC=-5.64449 SBC = -5.49096 p 1 q 3 AIC -5.66783 SBC = -5.47591 p 2 q 0 AIC -5.69010 SBC -5.57422 p 2 q 1 AIC -5.73284 SBC = -5.57833 p 2 q 2 AIC -5.73541 SBC -5.54228 p 2 q 3 AIC -5.73794 SBC = -5.50619 p=3q 0 AIC=-5.75376 SBC = -5.59212 p 3q 1 AIC -5.75388 SBC = -5.59951 p=3q 2 AIC -5.75934 SBC -5.52110 p=3q=3AIC=-5.75693 SBC -5.48482 1. I estimate the ARIMA(p,d,q) model chosen by Schwartz criteria (BIC). Provide diagnostic check-ups for the residuals by examining the ACF. Do the residuals appear to be white noise? 1. Examine the Ljung Box statistics below. State the null and alternative hypothesis for the Ljung-Box test and explain the result of your test. Do the residuals appear to be a white noise process at 5% significance level? Ljung Box test R output: Ib_stat lb_pvalue difflogr10 9.75 0.112
Step by Step Solution
There are 3 Steps involved in it
Step: 1

Get Instant Access to Expert-Tailored Solutions
See step-by-step solutions with expert insights and AI powered tools for academic success
Step: 2

Step: 3

Ace Your Homework with AI
Get the answers you need in no time with our AI-driven, step-by-step assistance
Get Started


