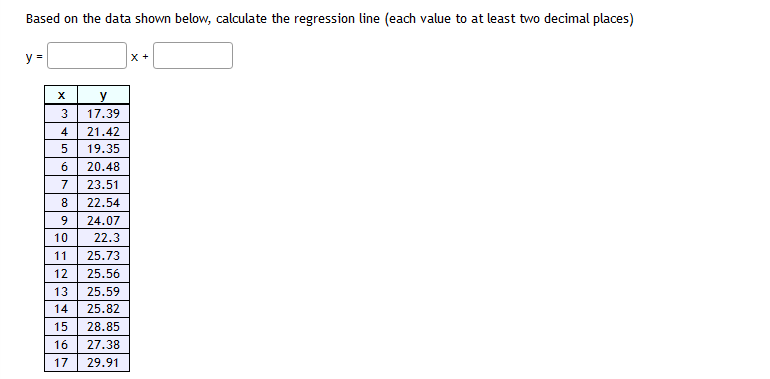
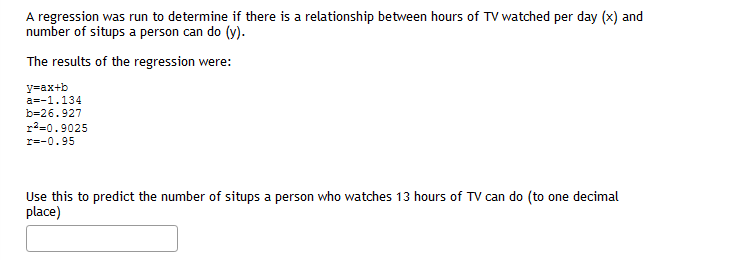
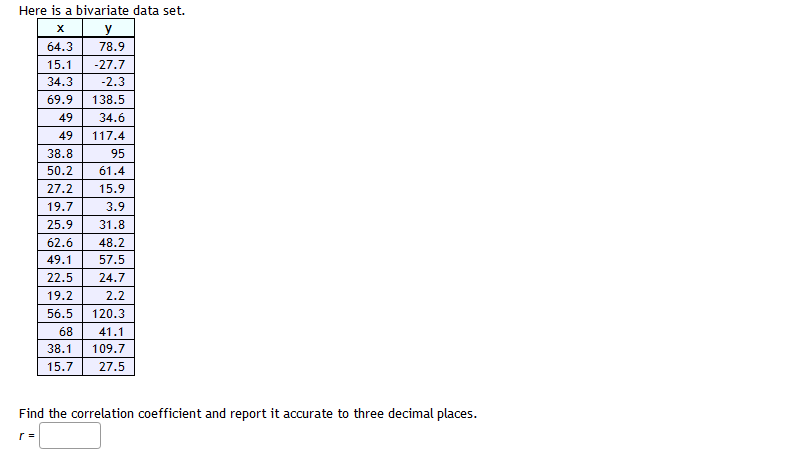
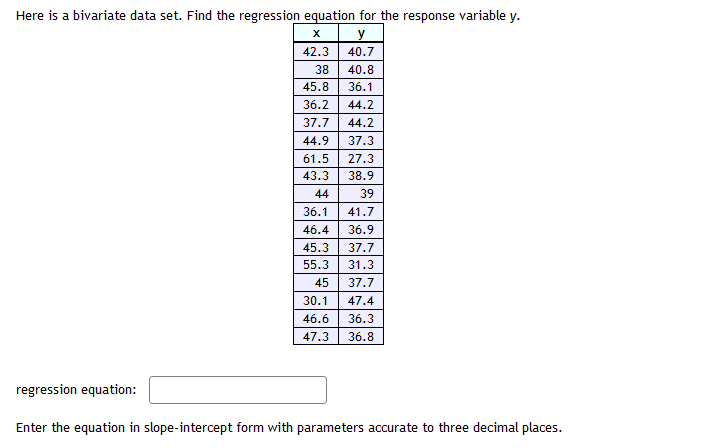
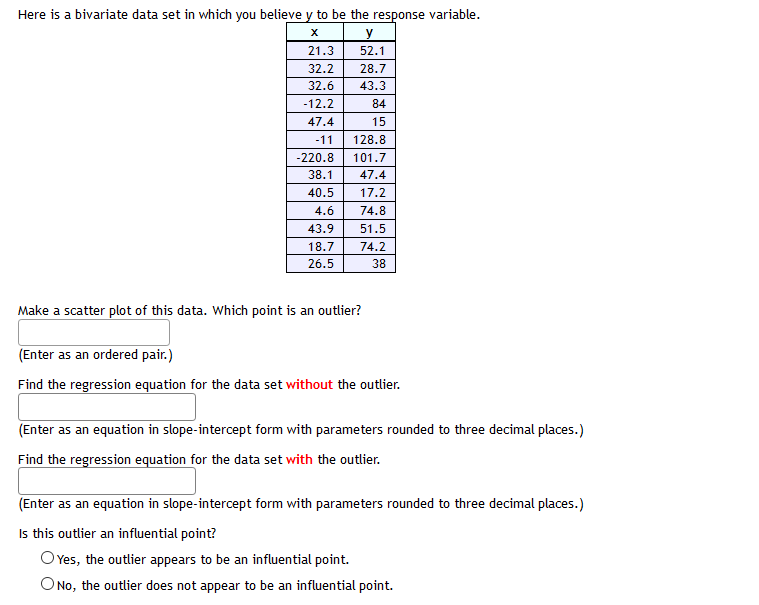
Based on the data shown below, calculate the regression line {each value to at least two decimal places} A regression was run to determine if there is a relationship between hours of T'H'watch ed per day {x} and number of situps a person can do {yr}. The resuLts of the regression were: 5r=ax+b a=1.134 b=26.92? r3=.9025 r=-.95 Use this to predict the number of situps a person who watches 13 hours of T'I.Ir can do {to one decimaL place} :1 Here is a bivariate data set. @- - m Find the correlation coefficient and report it accurate to three decimal places. Here is a bivariate data set. Find the regression equation for the response variable y. X y 42.3 40.7 38 40.8 45.8 36.1 36.2 44.2 37.7 44.2 44.9 37.3 61.5 27.3 43.3 38.9 44 39 36.1 41.7 46.4 36.9 45.3 37.7 55.3 31.3 45 37.7 30.1 47.4 46.6 36.3 47.3 36.8 regression equation: Enter the equation in slope-intercept form with parameters accurate to three decimal places.Here is a bivariate data set in which you believe y to be the response variable. X y 21.3 52.1 32.2 28.7 32.6 43.3 12.2 84 47.4 15 -11 128.8 220.8 101.7 38.1 47.4 40.5 17.2 4.6 74.8 43.9 51.5 18.7 74.2 26.5 38 Make a scatter plot of this data. Which point is an outlier? (Enter as an ordered pair.) Find the regression equation for the data set without the outlier. (Enter as an equation in slope-intercept form with parameters rounded to three decimal places.) Find the regression equation for the data set with the outlier. (Enter as an equation in slope-intercept form with parameters rounded to three decimal places.) Is this outlier an influential point? OYes, the outlier appears to be an influential point. ONo, the outlier does not appear to be an influential point.A researcher wish es to examine the relationship between years of schooling completed and the number of pregnancies in young women. Her research discovers a Linear relationship, and the least squares line is: y = 5 Ez'where X is the number of years of schooling completed and y is the number of pregnancies. The slope of the regression line can be interpreted in the following way: 0 When amount of schooling increases by one year, the number of pregnancies decreases by 3. 0 When amount of schooling increases by one year, the number of pregnancies increases by 3. C} When amount of schooling increases by one year, the number of pregnancies decreases by 5. 0 When amount of schooling increases by one year, the number of pregnancies increases by 5
