Based on the data, write a result section verbalizing this data

REFERENCE

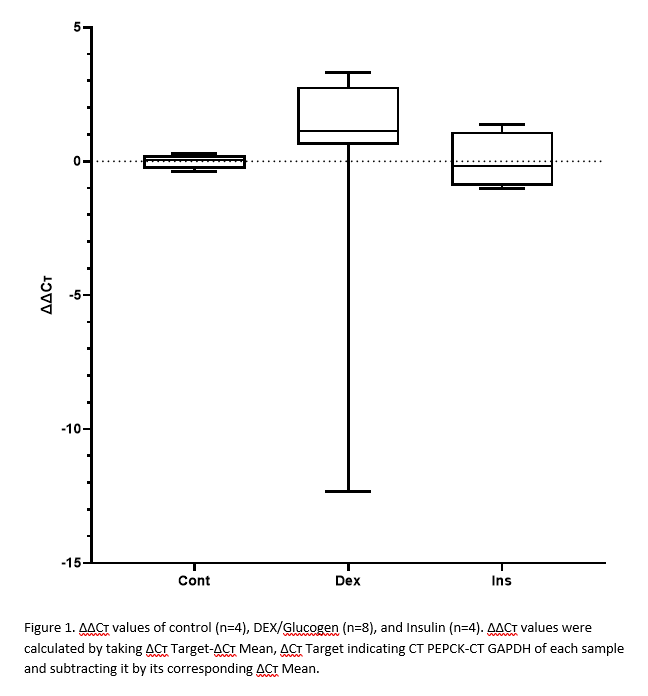
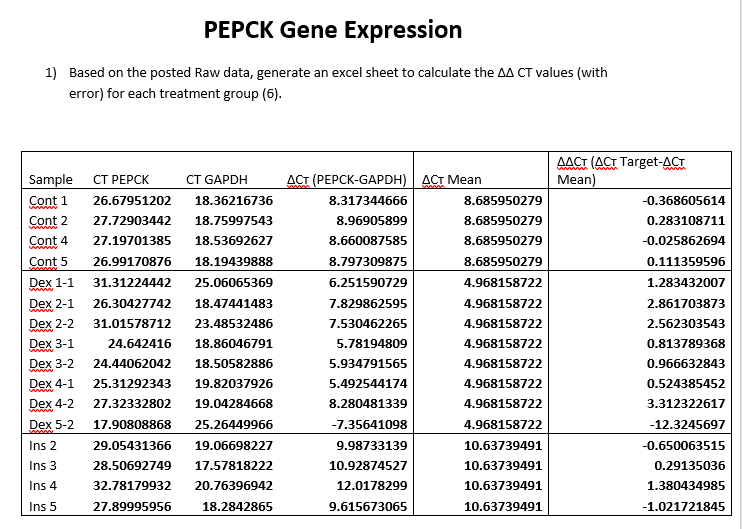
AACT -15- Cont Dex Ins Figure 1. AAC values of control (n=4), DEX/Glucogen (n=8), and Insulin (n=4). AACT values were calculated by taking ACT Target-ACT Mean, ACT Target indicating CT PEPCK-CT GAPDH of each sample and subtracting it by its corresponding ACT Mean. PEPCK Gene Expression 1) Based on the posted Raw data, generate an excel sheet to calculate the AA CT values (with error) for each treatment group (6). Sample Cont 1 Cont 2 Cont 4 Cont 5 Dex 1-1 Dex 2-1 Dex 2-2 Dex 3-1 Dex 3-2 Dex 4-1 Dex 4-2 Dex 5-2 Ins 2 Ins 3 Ins 4 Ins 5 CT PEPCK 26.67951202 27.72903442 27.19701385 26.99170876 31.31224442 26.30427742 31.01578712 24.642416 24.44062042 25.31292343 27.32332802 17.90808868 29.05431366 28.50692749 32.78179932 27.89995956 CT GAPDH 18.36216736 18.75997543 18.53692627 18.19439888 25.06065369 18.47441483 23.48532486 18.86046791 18.50582886 19.82037926 19.04284668 25.26449966 19.06698227 17.57818222 20.76396942 18.2842865 ACT (PEPCK-GAPDH) ACT Mean 8.317344666 8.685950279 8.96905899 8.685950279 8.660087585 8.685950279 8.797309875 8.685950279 6.251590729 4.968158722 7.829862595 4.968158722 7.530462265 4.968158722 5.78194809 4.968158722 5.934791565 4.968158722 5.492544174 4.968158722 8.280481339 4.968158722 -7.35641098 4.968158722 9.98733139 10.63739491 10.92874527 10.63739491 12.0178299 10.63739491 9.615673065 10.63739491 AACT (ACT Target-ACT Mean) -0.368605614 0.283108711 -0.025862694 0.111359596 1.283432007 2.861703873 2.562303543 0.813789368 0.966632843 0.524385452 3.312322617 -12.3245697 -0.650063515 0.29135036 1.380434985 -1.021721845 AACT -15- Cont Dex Ins Figure 1. AAC values of control (n=4), DEX/Glucogen (n=8), and Insulin (n=4). AACT values were calculated by taking ACT Target-ACT Mean, ACT Target indicating CT PEPCK-CT GAPDH of each sample and subtracting it by its corresponding ACT Mean. PEPCK Gene Expression 1) Based on the posted Raw data, generate an excel sheet to calculate the AA CT values (with error) for each treatment group (6). Sample Cont 1 Cont 2 Cont 4 Cont 5 Dex 1-1 Dex 2-1 Dex 2-2 Dex 3-1 Dex 3-2 Dex 4-1 Dex 4-2 Dex 5-2 Ins 2 Ins 3 Ins 4 Ins 5 CT PEPCK 26.67951202 27.72903442 27.19701385 26.99170876 31.31224442 26.30427742 31.01578712 24.642416 24.44062042 25.31292343 27.32332802 17.90808868 29.05431366 28.50692749 32.78179932 27.89995956 CT GAPDH 18.36216736 18.75997543 18.53692627 18.19439888 25.06065369 18.47441483 23.48532486 18.86046791 18.50582886 19.82037926 19.04284668 25.26449966 19.06698227 17.57818222 20.76396942 18.2842865 ACT (PEPCK-GAPDH) ACT Mean 8.317344666 8.685950279 8.96905899 8.685950279 8.660087585 8.685950279 8.797309875 8.685950279 6.251590729 4.968158722 7.829862595 4.968158722 7.530462265 4.968158722 5.78194809 4.968158722 5.934791565 4.968158722 5.492544174 4.968158722 8.280481339 4.968158722 -7.35641098 4.968158722 9.98733139 10.63739491 10.92874527 10.63739491 12.0178299 10.63739491 9.615673065 10.63739491 AACT (ACT Target-ACT Mean) -0.368605614 0.283108711 -0.025862694 0.111359596 1.283432007 2.861703873 2.562303543 0.813789368 0.966632843 0.524385452 3.312322617 -12.3245697 -0.650063515 0.29135036 1.380434985 -1.021721845


