Answered step by step
Verified Expert Solution
Question
1 Approved Answer
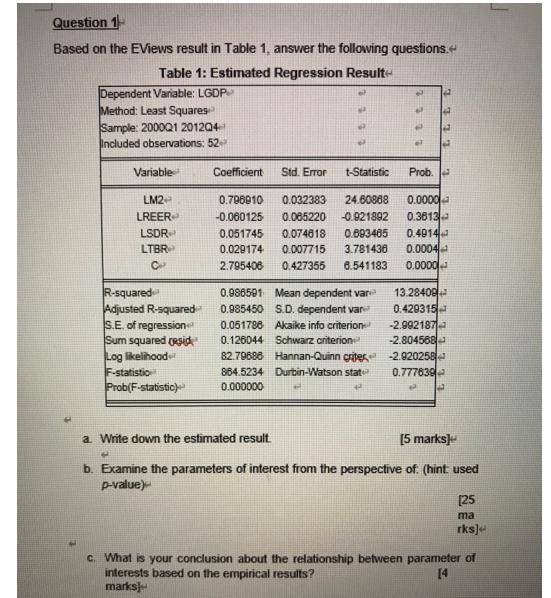
Based on the EViews result in Table 1, answer the following questions. < Table 1: Estimated Regression Result Dependent Variable: LGDP Method: Least Squares

Based on the EViews result in Table 1, answer the following questions. < Table 1: Estimated Regression Result Dependent Variable: LGDP Method: Least Squares Sample: 2000Q1 201204 Included observations: 52 Variable LM2+ LREER LSDR LTBR C R-squared Adjusted R-squared S.E. of regression Sum squared (sid Log likelihood F-statistio Prob(F-statistic) Coefficient Std. Error t-Statistic Prob. 0.796910 0.032383 24.60888 0.0000 -0.060125 0.065220 -0.921892 0.3613 0.051745 0.074818 0.893465 0.4914 0.029174 0.007715 3.781436 0.0004 2.795408 0.427355 6.541183 0.0000 0.986591 Mean dependent var S.D. dependent var 0.985450 0.051786 Akaike info criterion 0.126044 Schwarz criterion 82.79686 Hannan-Quinn criter 864.5234 Durbin-Watson stat 0.000000 a. Write down the estimated result. 4 13.28409 0.429315 -2.992187 -2.804568 -2.920258 0.777639 a [5 marks] b. Examine the parameters of interest from the perspective of: (hint: used p-value) [25 ma rks]+ c. What is your conclusion about the relationship between parameter of interests based on the empirical results? marks]+ [4
Step by Step Solution
★★★★★
3.44 Rating (144 Votes )
There are 3 Steps involved in it
Step: 1
The detailed ...
Get Instant Access to Expert-Tailored Solutions
See step-by-step solutions with expert insights and AI powered tools for academic success
Step: 2

Step: 3

Ace Your Homework with AI
Get the answers you need in no time with our AI-driven, step-by-step assistance
Get Started


