Answered step by step
Verified Expert Solution
Link Copied!

Question

1 Approved Answer

Based on the excel report (I attached a pic of the excel below and also pasted the info at the bottom of the question). Thannks!

image text in transcribed

Based on the excel report (I attached a pic of the excel below and also pasted the info at the bottom of the question).

Thannks!

image text in transcribed
SUMMARY OUTPUT Regression Statistics Multiple R 0.535927511 R Square 0.287218297 Adjusted R Square 0.26625413 Standard Error 6938.734668 Observations 36 ANOVA df SS MS F Significance F Regression 1 659621859.2 659621859.2 13.70043883 0.000755105 Residual 34 1636965319 48146038.79 Total 35 2296587178 Coefficients Standard Error t Stat P-value Lower 95% Upper 95% Lower 95.0% Upper 95.0% Intercept 819247.4551 51893.25883 15.7871653 3.219598-17 713787.6648 924707.2454 713787.6648 924707.2454 Advertising Expenses 3.677554271 0.993554859 3.701410384 0.000755105 1.658407864 5.696700677 1.658407864 5.696700677

Step by Step Solution

There are 3 Steps involved in it

Step: 1

blur-text-image

Get Instant Access to Expert-Tailored Solutions

See step-by-step solutions with expert insights and AI powered tools for academic success

Step: 2

blur-text-image

Step: 3

blur-text-image

Ace Your Homework with AI

Get the answers you need in no time with our AI-driven, step-by-step assistance

Get Started

Recommended Textbook for

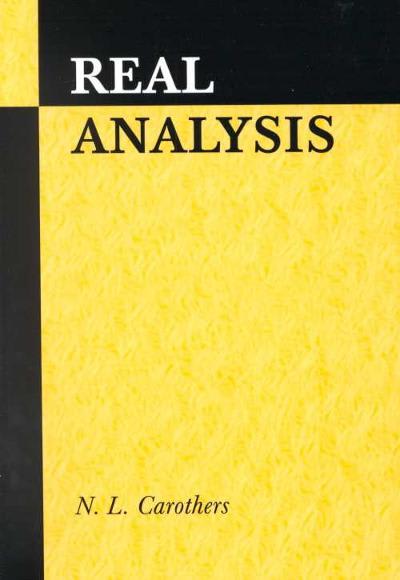
Real Analysis

Authors: N L Carothers

1st Edition

1139632434, 9781139632430

More Books

Students also viewed these Mathematics questions