Answered step by step
Verified Expert Solution
Link Copied!

Question

1 Approved Answer

Based on the figure below, with the blue line representing actual GDP and the white line representing potential GDP, which best analyzes the how the
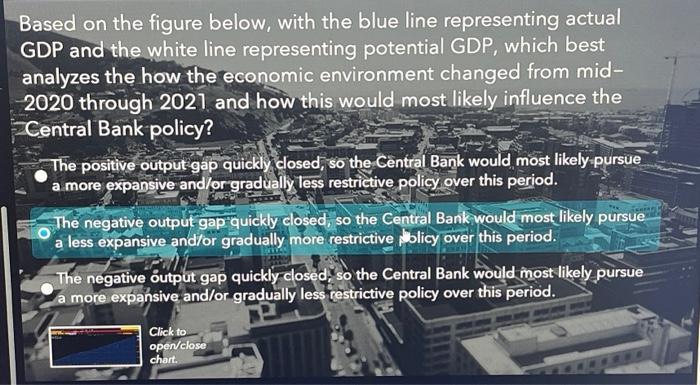
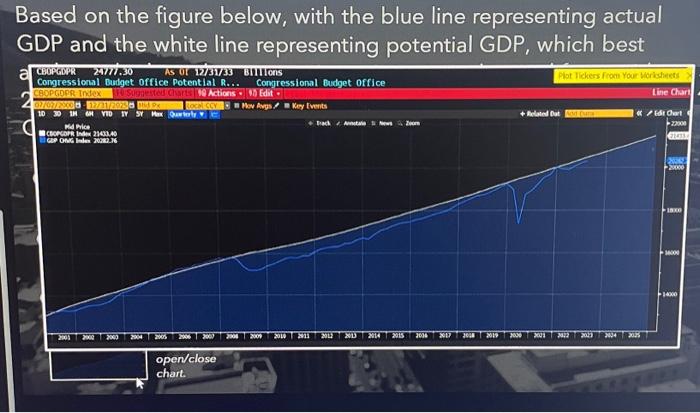
image text in transcribed
Based on the figure below, with the blue line representing actual GDP and the white line representing potential GDP, which best analyzes the how the economic environment changed from mid2020 through 2021 and how this would most likely influence the Central Bank policy? The positive output gap quickly closed, so the Central Bank would most likely pursue a more expansive and/or gradual/y less restrictive policy over this period. The negative output gap quickly closed, so the Central Bank would most likely pursue a less expansive and/or gradually more restrictive / licy over this period. The negative output gap quickly closed so the Central Bank would most likely pursue a more expansive and/or gradually less restrictive policy over this period. Based on the figure below, with the blue line representing actual GDP and the white line representing potential GDP, which best

Step by Step Solution

There are 3 Steps involved in it

Step: 1

blur-text-image

Get Instant Access to Expert-Tailored Solutions

See step-by-step solutions with expert insights and AI powered tools for academic success

Step: 2

blur-text-image_2

Step: 3

blur-text-image_3

Ace Your Homework with AI

Get the answers you need in no time with our AI-driven, step-by-step assistance

Get Started

Recommended Textbook for

Housing Policy And Finance

Authors: John Black, David Stafford

1st Edition

0415004195, 978-0415004190

More Books

Students also viewed these Finance questions

Question

What is the role of the Joint Commission in health care?

Answered: 1 week ago