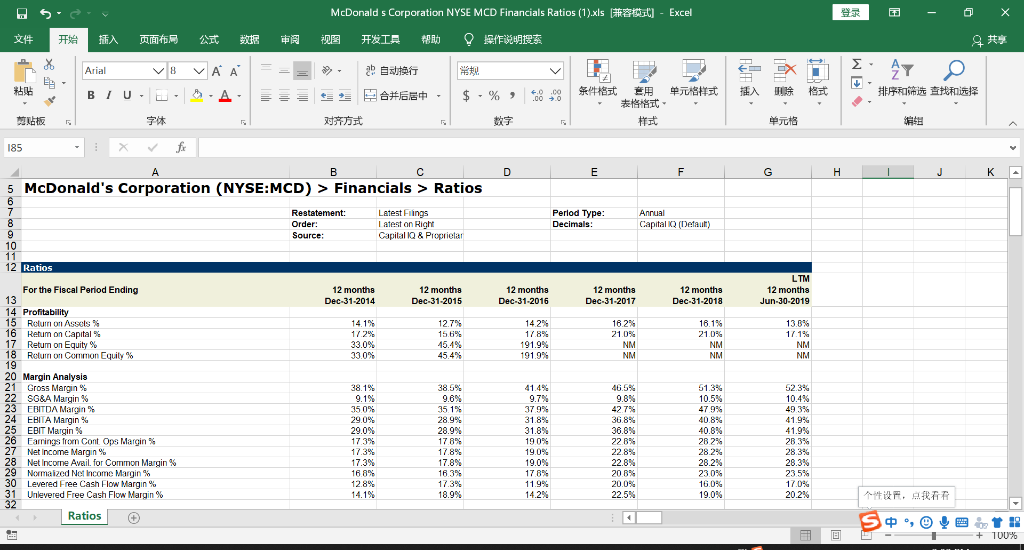
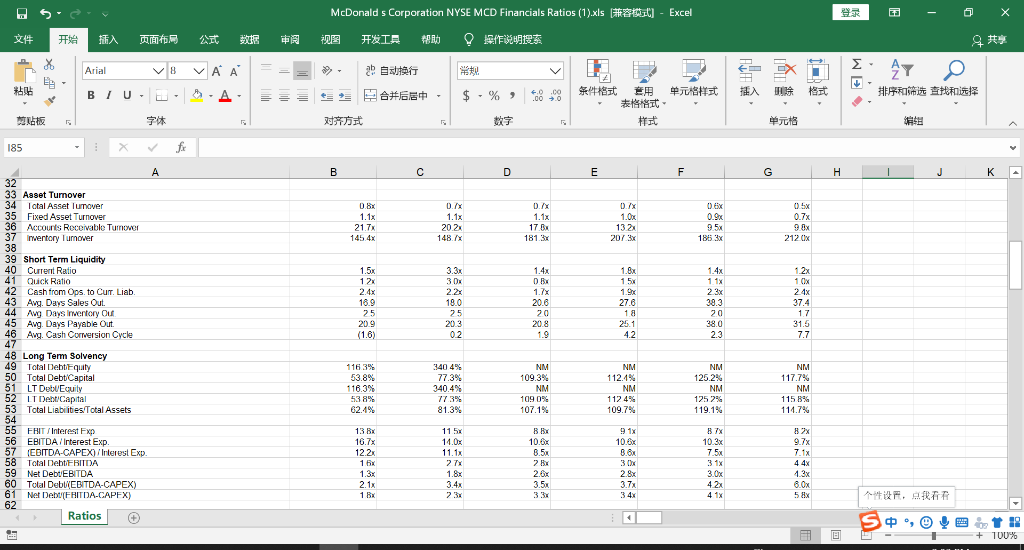
Based on the financial ratios below. What's the potential problems for McDonald's?


03C) - Excel 2 - 0 X _ Arial V8 VAA= = = BLUEA McDonalds Corporation NYSE MCD Financials Ratios (1).xls (# 9 2 BRT ** E #6 - $ - % 48,40 * ** EXAY # Hit this! 1 # TC#5 185 D G H J KA 5 McDonald's Corporation (NYSE:MCD) > Financials > Ratios Restatement: Order: Source: Latest Filings Latest on Right Capital 10 & Proprietar Perlod Type: Decimals: Annual Capital IQ (Default) 12 Ratios 12 months Dec-31-2014 12 months Dec-31-2015 12 months Dec-31-2016 12 months Dec-31-2017 12 months Dec-31-2018 LIM 12 months Jun-30-2019 For the Fiscal Period Ending 13 14 Profitability 15 Return on Assels 16 Ketum on Capital 17 Retum on Equity % 18 Return on Common Equily 138% 14.1% 1/29 33.0% 33.0% 12.7% 15 % 45.4% 45.4% 14.2% 178 191.9% 191.9% 16.25 21 096 NM NM 16.1% 21 % NM NM 17 19 NM NM 20 Margin Analysis 21 Gross Margin% 22 SG&A Margin % 23 FRUITDA Marcin 24 EBITA Margin % 25 EBIT Margin% 26 Earrings from Cont Ops Margin % 27 Net Income Margin% 28 Net Income Avail. for Common Margin% 29 Normaized Net Income Margin % 30 Levered Free Cash Flow Margin % 31 Unlevered Free Cash Flow Margin % 38.1% 9.1% 3509 29 0% 29.0% 1739 173% 17.3% 16 A 12.8% 14.1% 38.5% 9.6% 3519 28.9% 28.9% 178 17.8% 17.8% 1839 17.3% 18.9% 41.4% 9.7% 37.99 318% 31.8% 1909 19.0% 19.0% 17 B 1199 14.2% 46.5% 9.8% 42 796 36 896 38.8% 228% 22 896 22.8% 20 20.0% 22.5% 51.3% 10.5% 47 9% 408% 40.8% 28 29 28.2% 28.2% 2309 16 0% 19.0% 52.3% 10.4% 49 3% 41.9% 41.9% 28 3% 28.3% 28.3% 2355 17.0% 20.2% i . Ratios S , Ea t - + 100% 03C) - Excel 2 - 0 X X14 % X 2 E Arial V8 VAA BIU- A McDonalds Corporation NYSE MCD Financials Ratios (1).xls (# FEIA AD AESex > a ** E #6 - $ - % 48,40 * * EXAY # Hit this! 1 # TC#5 185 B C D E F G H I J K A 0.8x 33 Asset Turnover 34 Total Asset lumover 35 Fixed Asset Turnover 36 Accounts Rocovable Tumover 37 Invertory Turnover 1.1% DIX 1. 1x 20.2 148 X 21.7% 145 4x D.XX 1.1x 17 B 181 3x 1.04 132 207.3x 06X 0.9% 9 5x 185 9x 0.7x 9X 212 Ux 1 5x 1.4% 1.4x DRE 12 1 x 15 1 2x 3.3 3 DE 2.23 18.0 17 1.9% 2.4x 16.9 25 2.3% 39.3 24x 37.4 20.6 27.6 25 20 20 17 20.9 20.8 39 Short Term Liquidity 40 Current Ratio 41 Quick Ratio 42 Cash from Ops to Curr. Liab. 43 Avg. Duys Sales Out. 44 Aug Days Invertory Ou 45 Avg. Days Payable Out. 46 Avg. Cash Corversion Cycle 47 48 Long Term Solvency 49 Total Debt Equity 50 Total Debt Capital 51 LT Debu Equity 52 IT Debu Capital 53 Total Liabilites/Total Assets 20.3 0.2 18 26.1 42 38.0 2.3 31.5 (1.6) 7.7 NM NM NM 109.3% 116.3% 53.8% 116.3% 538% 62.4% 340.4% 77.3% 340 4% 7739 81.3% 1121% NM 1124 109.7% 125.2% NM 1252% 119.1% NM 117.7% NM 1158% 114.7% 109 0 107.1% 55 91% 11 5x 14.0 11.1x BE 10.0% 8.5% 100% 13 Bi 16.7x 122 1 x 10.3 9.7% 75% 71x 30 2x 31% FHIT Interest Exp 56 EBITDA/ Interest Exp. 57 EBITDA-CAPEX)/Interest Exp. 58 Total Debt EBITDA 59 Net Debt EBITDA 60 Total DebYEBITDA-CAPEX) 61 Net Debt (FHITDA-CAPEX) Ratios 18x 2x 2.1x 3.4x 3.54 3.7% 6.Ox 1 BX 41 5 x i . A 62 So, 04:11 - + 100%


