

Question
Based on the following data: Age Hours 6 108 4 32 10 200 7 98 12 363 7 98 7 147 11 242 5 75
- Based on the following data:
Age | Hours |
6 | 108 |
4 | 32 |
10 | 200 |
7 | 98 |
12 | 363 |
7 | 98 |
7 | 147 |
11 | 242 |
5 | 75 |
6 | 72 |
11 | 242 |
6 | 72 |
- Recall that a linear regression function has the format ????(????)=????????+????. Calculate a linear regression for the data above and indicate the value of a:
- Recall that a linear regression function has the format ????(????)=????????+????. Calculate a linear regression for the data above and indicate the value of b:
- Recall that a linear regression function has the format ????(????)=????????+????. Calculate a linear regression for the data above and indicate the value of ????2:
- Recall that a polynomial regression function has the format ????(????)=????????2+????????+????. Calculate a polynomial regression for the data above and indicate the value of ????:
- Recall that a polynomial regression function has the format ????(????)=????????2+????????+????. Calculate a polynomial regression for the data above and indicate the value of ????:
- Recall that a polynomial regression function has the format ????(????)=????????2+????????+????. Calculate a polynomial regression for the data above and indicate the value of ????:
- Recall that a polynomial regression function has the format ????(????)=????????2+????????+????. Calculate a polynomial regression for the data above and indicate the value of ????2:
- Considering the regression curve in the chart, estimate the number of cases on day 20. Keep in mind that number of cases is not a decimal value. 9. Considering the regression curve in the chart, estimate the number of cases on day 22. Keep in mind that number of cases is not a decimal value.
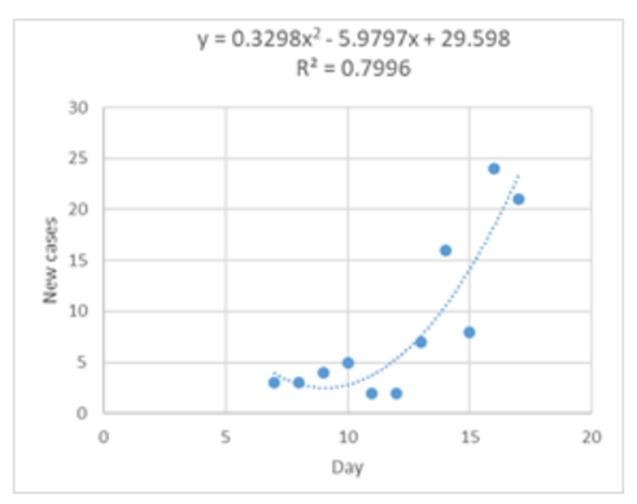 9. Considering the regression curve in the chart, estimate the number of cases on day 22. Keep in mind that number of cases is not a decimal value.
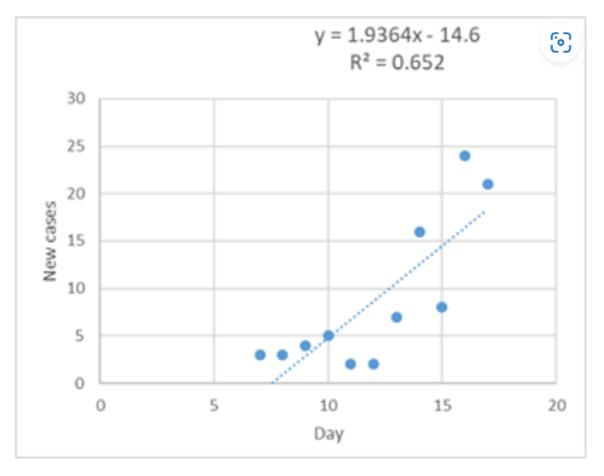
10. Which one of the presented regressions is better suited to describe the data shown below? Choose 1
The linear regression
The quadratic regression
The exponential regression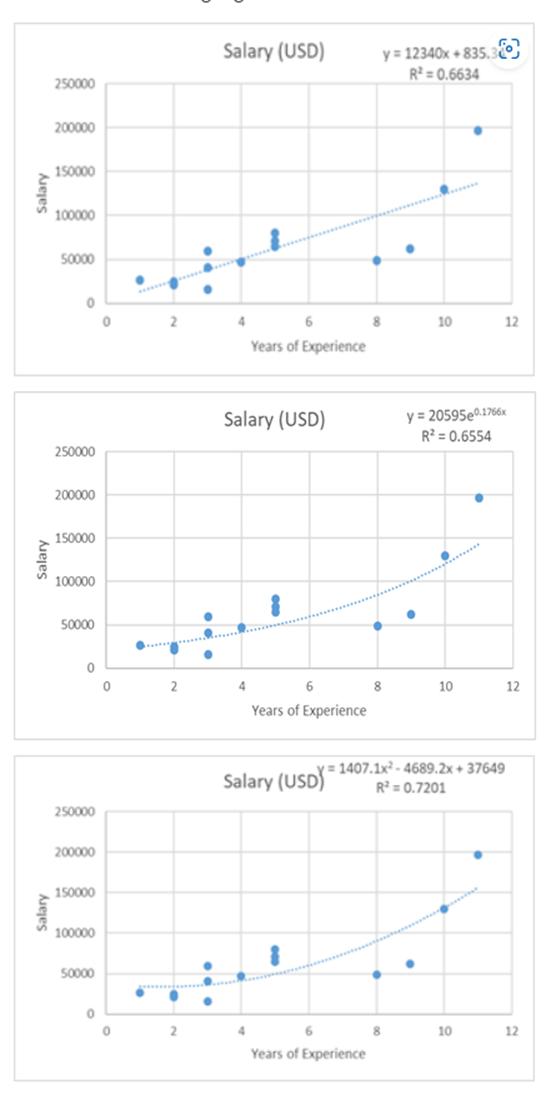
11. Which of the presented regressions would you actually use to predict the outcome? (choose 1)
The linear regression
The quadratic regression
The exponential regression
None of the presented regressions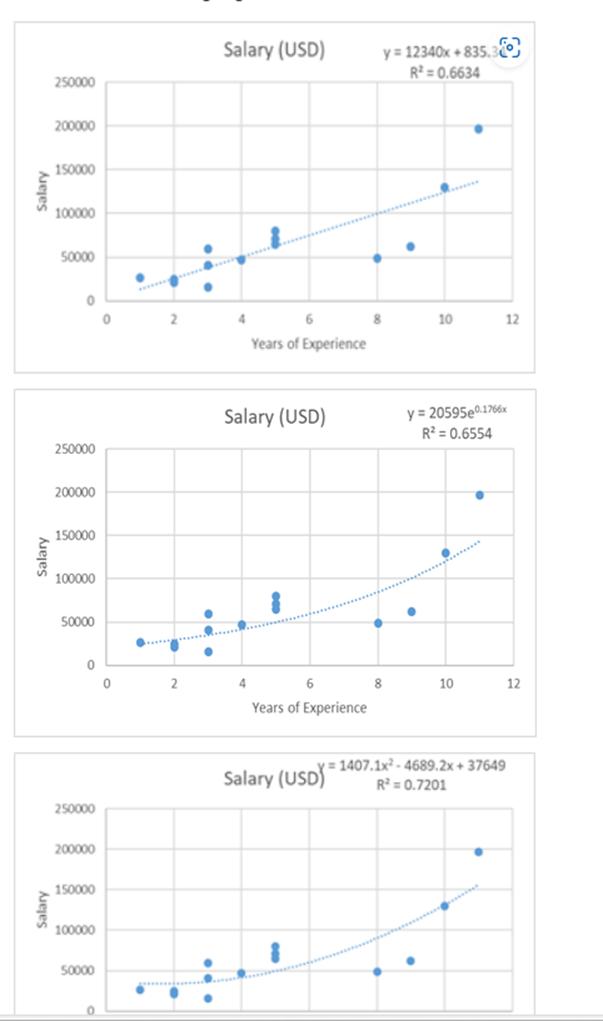
30 30 15 25 y=0.3298x2-5.9797x+29.598 R2=0.7996 20 15 16 New cases 10 10 5 S 10 Day 15 20 20 30 30 15 25 y=0.3298x2-5.9797x+29.598 R2=0.7996 20 15 16 New cases 10 10 5 S 10 Day 15 20 20
Step by Step Solution
There are 3 Steps involved in it
Step: 1

Get Instant Access to Expert-Tailored Solutions
See step-by-step solutions with expert insights and AI powered tools for academic success
Step: 2

Step: 3
Ace Your Homework with AI
Get the answers you need in no time with our AI-driven, step-by-step assistance
Get Started
Differential Equations A Maple™ Supplement
Authors: Robert P Gilbert, George C Hsiao, Robert J Ronkese
2nd Edition