Based on the income statement and balance sheet. Can you tell me the problem JetBlue is facing?


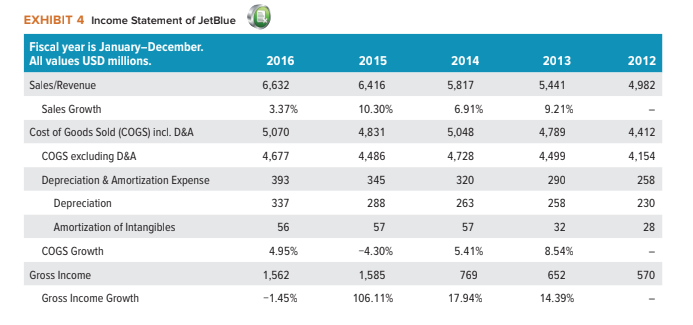
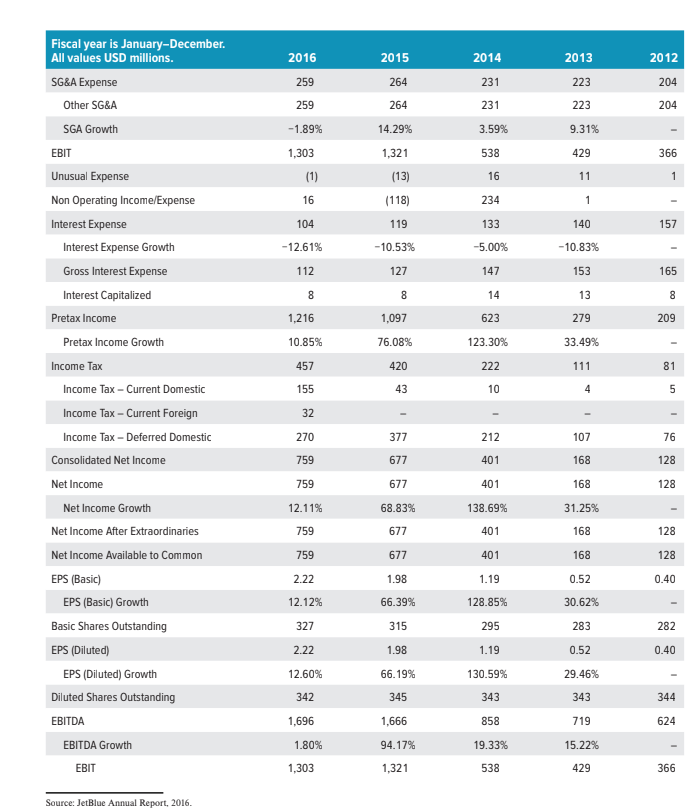
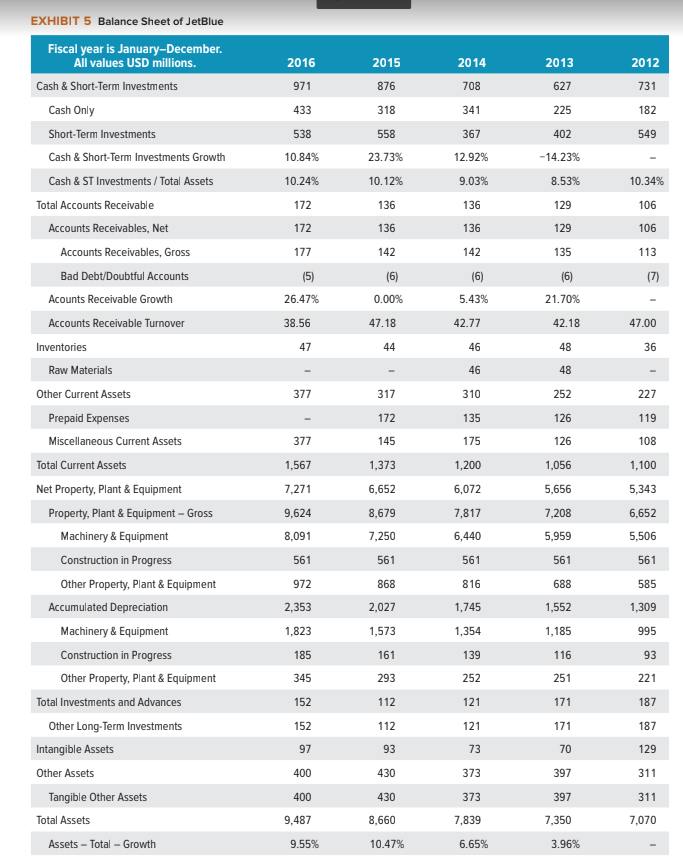
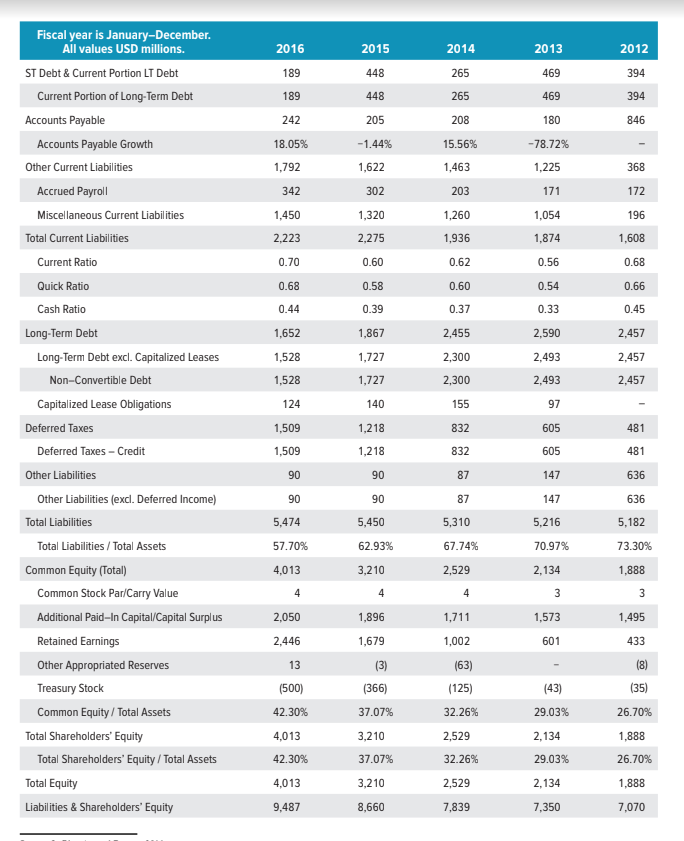
EXHIBIT 4 Income Statement of JetBlue Fiscal year is January-December. All values USD millions. 2016 2015 2013 2012 4,982 Sales/Revenue 6,632 6,416 5,441 2014 5,817 6.91% 5,048 Sales Growth 3.37% 10.30% 4,831 9.21% 4,789 Cost of Goods Sold (COGS) incl. D&A 5,070 4,412 COGS excluding D&A 4,499 4,677 393 337 4,154 258 Depreciation & Amortization Expense 290 4,486 345 288 57 4,728 320 263 57 Depreciation 258 Amortization of Intangibles 56 COGS Growth 4.95% -4.30% 5.41% 8.54% Gross Income 769 652 1,562 -1.45% 1,585 106.11% Gross Income Growth 17.94% 14.39% Fiscal year is January-December. All values USD millions. 2016 2013 2012 SG&A Expense 259 2015 264 264 2014 231 231 204 223 223 Other SG&A 259 SGA Growth -1.89% 3.59% 9.31% 14.29% 1,321 EBIT 429 1,303 (1) 16 538 16 Unusual Expense 11 (13) (118) Non Operating Income/Expense 234 Interest Expense Interest Expense Growth 104 -12.61% 112 119 -10.53% 127 133 -5.00% 147 Gross Interest Expense Interest Capitalized Pretax Income 140 -10.83% 153 13 279 33.49% 14 1,216 10.85% 457 1,097 76.08% Pretax Income Growth 623 123.30% 222 Income Tax Income Tax - Current Domestic Income Tax - Current Foreign Income Tax-Deferred Domestic Consolidated Net Income 759 401 168 677 677 Net Income 759 401 168 Net Income Growth 12.11% 138.69% 68.83% 677 31.25% 168 Net Income After Extraordinaries 759 401 Net Income Available to Common 759 677 401 168 2.22 1.98 1.19 0.52 0.40 EPS (Basic) EPS (Basic) Growth 12.12% 66.39% 128.85% 30.62% Basic Shares Outstanding 327 315 295 283 282 EPS (Diluted) 2.22 1.98 1.19 0.52 0.40 EPS (Diluted) Growth 12.60% 66.19% 130.59% 29.46% 342 344 Diluted Shares Outstanding EBITDA 345 1,666 94.17% 343 858 343 719 1,696 EBITDA Growth 1.80% 19.33% 538 15.22% 429 EBIT 1,303 1,321 Source: JetBlue Annual Report, 2016. EXHIBIT 5 Balance Sheet of JetBlue Fiscal year is January-December. All values USD millions. 2015 Cash & Short-Term Investments 876 318 2016 971 433 538 10.84% 10.24% 2012 731 182 549 Cash Only Short-Term Investments 558 2014 708 341 367 12.92% 9.03% 136 136 2013 627 225 402 -14.23% 8.53% 129 23.73% Cash & Short-Term Investments Growth Cash & ST Investments / Total Assets 10.12% Total Accounts Receivable 136 172 172 10.34% 106 106 Accounts Receivables, Net 136 129 Accounts Receivables, Gross 177 142 135 Bad Debt/Doubtful Accounts 15) (6) 142 (6) 5.43% Acounts Receivable Growth 26.47% 0.00% 21.70% Accounts Receivable Turnover 38.56 47.18 42.18 47.00 Inventories 47 Raw Materials 42.77 46 46 310 135 Other Current Assets 317 48 252 126 227 Prepaid Expenses 172 119 Miscellaneous Current Assets 377 145 175 126 108 Total Current Assets 1,567 1,373 1,200 1,056 1,100 Net Property, Plant & Equipment 7,271 6,652 6,072 5,656 5,343 Property, Plant & Equipment - Gross 9,624 8,679 7,208 6,652 5,506 8,091 7,250 7,817 6,440 561 Machinery & Equipment Construction in Progress 5,959 561 561 561 561 Other Property, Plant & Equipment 972 868 816 688 585 Accumulated Depreciation 2,027 1,745 1,309 Machinery & Equipment 1,573 1,354 2,353 1,823 185 345 1,552 1,185 116 995 Construction in Progress 161 139 252 Other Property, Plant & Equipment 293 93 221 187 Total Investments and Advances Other Long-Term Investments Intangible Assets 187 129 93 73 97 400 Other Assets 430 373 Tangible Other Assets 400 430 373 7,839 70 397 397 7,350 3.96% 311 311 7,070 Total Assets 9,487 9.55% 8,660 10.47% Assets - Total - Growth 6.65% Fiscal year is January-December. All values USD millions. ST Debt & Current Portion LT Debt 2016 2015 2014 2013 2013 2012 189 448 265 469 394 Current Portion of Long-Term Debt 189 448 265 469 394 Accounts Payable 242 205 208 180 846 18.05% -1.44% 15.56% - 78.72% - Accounts Payable Growth Other Current Liabilities 1,792 1,463 1,225 1,622 302 368 172 Accrued Payroll 342 203 171 1,054 196 Miscellaneous Current Liabilities Total Current Liabilities 1,450 2,223 1,608 Current Ratio 1,320 2,275 0.60 0.58 0.39 1,874 0.56 0.70 1,260 1,936 0.62 0.60 0.37 0.68 Quick Ratio 0.68 0.54 Cash Ratio 0.44 0.33 Long-Term Debt 1,867 1,727 2,455 2,300 1,652 1,528 1,528 124 Long-Term Debt excl. Capitalized Leases Non-Convertible Debt 0.66 0.45 2,457 2,457 2,457 2,300 2,590 2,493 2,493 97 605 1,727 140 Capitalized Lease Obligations 155 Deferred Taxes 481 Deferred Taxes - Credit 832 605 481 Other Liabilities 1,509 1,509 90 90 5,474 1,218 1,218 90 90 5,450 87 147 636 Other Liabilities (excl. Deferred Income) 87 147 5,216 636 5.182 Total Liabilities 5,310 Total Liabilities/Total Assets 57.70% 62.93% 67.74% 70.97% 73.30% Common Equity (Total) 4,013 3,210 2,529 2,134 1,888 Common Stock Par/Carry Value Additional Paid-In Capital/Capital Surplus 2,050 1,896 1,711 1,495 1,573 601 Retained Earnings 1,679 433 Other Appropriated Reserves (3) 2,446 13 (500) 42.30% 1,002 (63) (125) Treasury Stock (366) (43) 29.03% (35) 26.70% Common Equity / Total Assets 32.26% 4,013 2,529 2,134 1.888 Total Shareholders' Equity Total Shareholders' Equity/Total Assets 37.07% 3,210 37.07% 3,210 42.30% 32.26% 29.03% 26.70% Total Equity 4,013 2,529 1,888 2,134 7,350 Liabilities & Shareholders' Equity 9,487 8,660 7,839 7,070


