Question
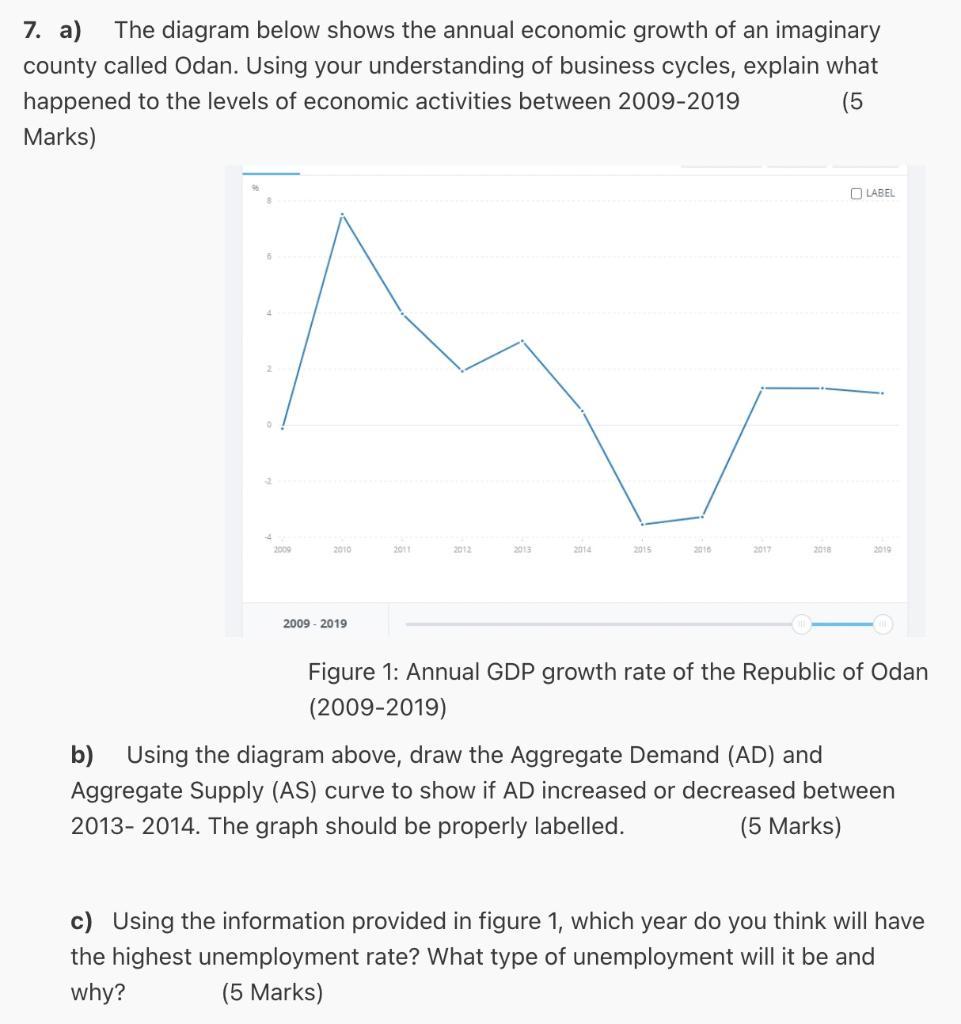
7. a) The diagram below shows the annual economic growth of an imaginary county called Odan. Using your understanding of business cycles, explain what

7. a) The diagram below shows the annual economic growth of an imaginary county called Odan. Using your understanding of business cycles, explain what happened to the levels of economic activities between 2009-2019 (5 Marks) -4 2009 2010 2009-2019 2011 2012 2013 2014 2015 2016 2017 2018 LABEL 2019 Figure 1: Annual GDP growth rate of the Republic of Odan (2009-2019) b) Using the diagram above, draw the Aggregate Demand (AD) and Aggregate Supply (AS) curve to show if AD increased or decreased between 2013-2014. The graph should be properly labelled. (5 Marks) c) Using the information provided in figure 1, which year do you think will have the highest unemployment rate? What type of unemployment will it be and why? (5 Marks)
Step by Step Solution
3.38 Rating (157 Votes )
There are 3 Steps involved in it
Step: 1

Get Instant Access to Expert-Tailored Solutions
See step-by-step solutions with expert insights and AI powered tools for academic success
Step: 2

Step: 3

Ace Your Homework with AI
Get the answers you need in no time with our AI-driven, step-by-step assistance
Get StartedRecommended Textbook for
Managerial Economics and Strategy
Authors: Jeffrey M. Perloff, James A. Brander
1st edition
978-0137036059, 133379094, 321566440, 137036051, 9780133379099, 978-0321566447
Students also viewed these Economics questions
Question
Answered: 1 week ago
Question
Answered: 1 week ago
Question
Answered: 1 week ago
Question
Answered: 1 week ago
Question
Answered: 1 week ago
Question
Answered: 1 week ago
Question
Answered: 1 week ago
Question
Answered: 1 week ago
Question
Answered: 1 week ago
Question
Answered: 1 week ago
Question
Answered: 1 week ago
Question
Answered: 1 week ago
Question
Answered: 1 week ago
Question
Answered: 1 week ago
Question
Answered: 1 week ago
Question
Answered: 1 week ago
Question
Answered: 1 week ago
Question
Answered: 1 week ago
Question
Answered: 1 week ago
Question
Answered: 1 week ago
Question
Answered: 1 week ago
Question
Answered: 1 week ago
Question
Answered: 1 week ago
View Answer in SolutionInn App


