Question
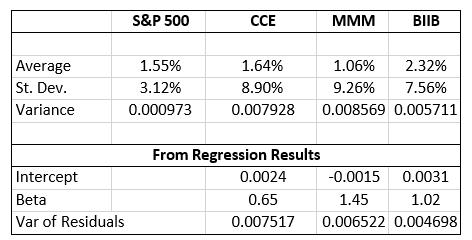
Based on the table, what is the proportion of the total risk for BIIB that can be explained by the market driven risk? S&P 500
- Based on the table, what is the proportion of the total risk for BIIB that can be explained by the market driven risk?

S&P 500 CCE MMM BIIB Average 1.55% 1.64% 1.06% 2.32% St. Dev. Variance 3.12% 8.90% 9.26% 7.56% 0.000973 0.007928 0.008569 0.005711 From Regression Results Intercept 0.0024 -0.0015 0.0031 Beta Var of Residuals 0.65 0.007517 1.45 1.02 0.006522 0.004698
Step by Step Solution
There are 3 Steps involved in it
Step: 1
To calculate the proportion of the total risk for BIIB that can be explained by the marketdriven ris...
Get Instant Access to Expert-Tailored Solutions
See step-by-step solutions with expert insights and AI powered tools for academic success
Step: 2

Step: 3

Ace Your Homework with AI
Get the answers you need in no time with our AI-driven, step-by-step assistance
Get StartedRecommended Textbook for
Cost management a strategic approach
Authors: Edward J. Blocher, David E. Stout, Gary Cokins
5th edition
73526940, 978-0073526942
Students also viewed these Finance questions
Question
Answered: 1 week ago
Question
Answered: 1 week ago
Question
Answered: 1 week ago
Question
Answered: 1 week ago
Question
Answered: 1 week ago
Question
Answered: 1 week ago
Question
Answered: 1 week ago
Question
Answered: 1 week ago
Question
Answered: 1 week ago
Question
Answered: 1 week ago
Question
Answered: 1 week ago
Question
Answered: 1 week ago
Question
Answered: 1 week ago
Question
Answered: 1 week ago
Question
Answered: 1 week ago
Question
Answered: 1 week ago
Question
Answered: 1 week ago
Question
Answered: 1 week ago
Question
Answered: 1 week ago
Question
Answered: 1 week ago
View Answer in SolutionInn App


