

Answered step by step
Verified Expert Solution
Question
1 Approved Answer
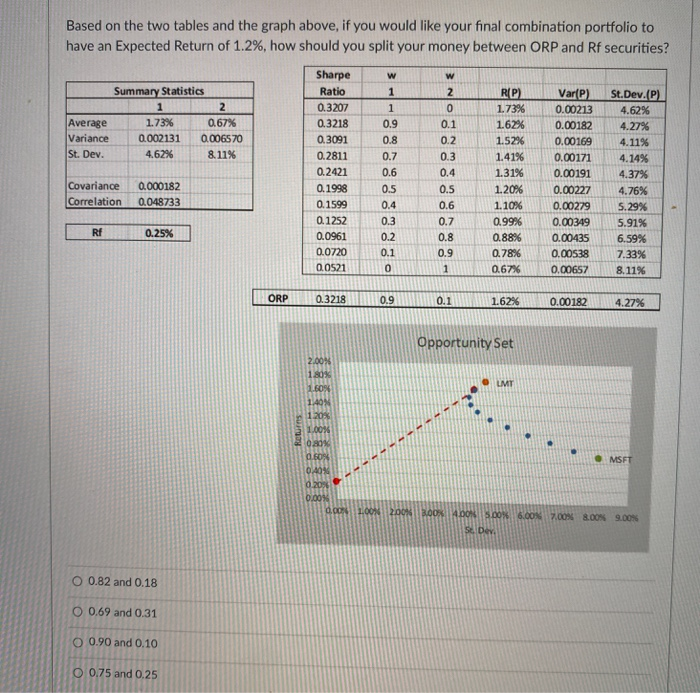
Based on the two tables and the graph above, if you would like your final combination portfolio to have an Expected Return of 1.2%, how
Step by Step Solution
There are 3 Steps involved in it
Step: 1

Get Instant Access to Expert-Tailored Solutions
See step-by-step solutions with expert insights and AI powered tools for academic success
Step: 2

Step: 3
Ace Your Homework with AI
Get the answers you need in no time with our AI-driven, step-by-step assistance
Get Started
Project Financing Asset-Based Financial Engineering
Authors: John D Finnerty
3rd Edition
1118421841, 9781118421840